Research
June 17, 2026
Total restaurant industry sales
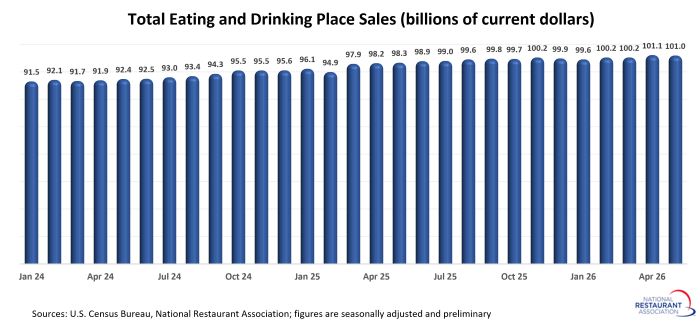
Restaurant sales held steady in May, as consumers remain resilient
Eating and drinking places registered total sales of $101.0 billion on a seasonally adjusted basis in May, according to preliminary data from the U.S. Census Bureau. That was down slightly from April’s sales volume of $101.1 billion.
The downtick in May came on the heels of healthy sales gains in two of the previous three months, despite the fact that restaurants were facing significant wallet competition from surging gas prices. While the positive trajectory paused in May, the latest readings suggest that many consumers are continuing to prioritize restaurants in their spending decisions.
A positive sign for restaurants is that pump prices are trending lower. While the national average for a gallon of regular gasoline has now been above $4 for nearly three months, it is about 50 cents off the mid-May peak. Factor in the recent resurgence of the U.S. labor market, and it’s likely that consumers on the aggregate will have the financial wherewithal to weather this period of elevated gas prices and continue spending.
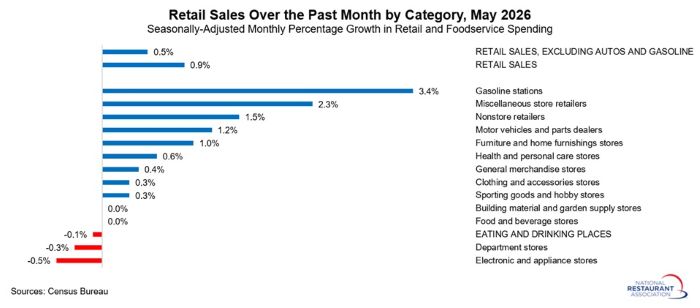
While restaurant sales were essentially unchanged in May, consumers did boost their spending in other areas. Not surprisingly, gasoline station sales jumped 3.4% in May – the third consecutive strong monthly gain. Although consumers spent a total of more than $27 billion more at gasoline stations in March, April and May than they did in February, they continued to spend in other areas.
Sales growth in other retail categories were led by miscellaneous store retailers (+2.3%), non-store retailers (+1.5%), motor vehicles and parts dealers (+1.2%) and furniture and home furnishing stores (+1.0%). Overall, non-restaurant retail sales were up a healthy 1.0% in May.
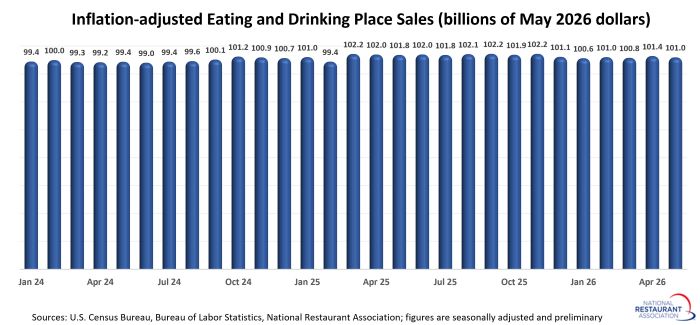
Although total spending in restaurants trended higher in recent months, much of that growth was driven by higher menu prices. In nominal terms, eating and drinking place sales were up 2.7% between May 2025 and May 2026.
However, on an inflation-adjusted basis, eating and drinking place sales were down 0.9% from year-ago levels in May. That represented the fourth real sales decline in the last five months (on a 12-month basis), and illustrates the ongoing challenge with uneven customer traffic levels.
Note: Eating and drinking places are the primary component of the U.S. restaurant and foodservice industry and represent approximately 72% of total restaurant and foodservice sales.
The downtick in May came on the heels of healthy sales gains in two of the previous three months, despite the fact that restaurants were facing significant wallet competition from surging gas prices. While the positive trajectory paused in May, the latest readings suggest that many consumers are continuing to prioritize restaurants in their spending decisions.
A positive sign for restaurants is that pump prices are trending lower. While the national average for a gallon of regular gasoline has now been above $4 for nearly three months, it is about 50 cents off the mid-May peak. Factor in the recent resurgence of the U.S. labor market, and it’s likely that consumers on the aggregate will have the financial wherewithal to weather this period of elevated gas prices and continue spending.
While restaurant sales were essentially unchanged in May, consumers did boost their spending in other areas. Not surprisingly, gasoline station sales jumped 3.4% in May – the third consecutive strong monthly gain. Although consumers spent a total of more than $27 billion more at gasoline stations in March, April and May than they did in February, they continued to spend in other areas.
Sales growth in other retail categories were led by miscellaneous store retailers (+2.3%), non-store retailers (+1.5%), motor vehicles and parts dealers (+1.2%) and furniture and home furnishing stores (+1.0%). Overall, non-restaurant retail sales were up a healthy 1.0% in May.
Although total spending in restaurants trended higher in recent months, much of that growth was driven by higher menu prices. In nominal terms, eating and drinking place sales were up 2.7% between May 2025 and May 2026.
However, on an inflation-adjusted basis, eating and drinking place sales were down 0.9% from year-ago levels in May. That represented the fourth real sales decline in the last five months (on a 12-month basis), and illustrates the ongoing challenge with uneven customer traffic levels.
Note: Eating and drinking places are the primary component of the U.S. restaurant and foodservice industry and represent approximately 72% of total restaurant and foodservice sales.