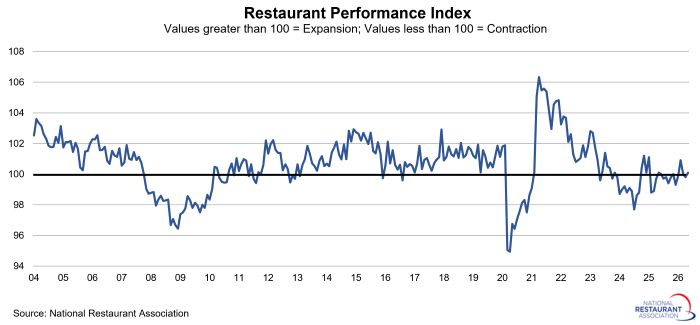
Restaurant Performance Index rose 0.2% in May
The National Restaurant Association’s Restaurant Performance Index (RPI) registered a modest gain in May, but continued to reflect challenging business conditions. The RPI – a monthly index that tracks the health of the U.S. restaurant industry – stood at 100.1 in May, up 0.2% from April and the first time in three months that the RPI rose above 100 into expansion territory.
Although sales and traffic readings improved somewhat from April, results were still mixed: 50% of operators reported higher same-store sales in May, while only 29% said their customer traffic rose. Looking ahead, restaurant operators are cautiously optimistic about sales in the coming months, but are much less bullish about the economy.
The Current Situation Index, which measures current trends in four industry indicators, stood at 99.7 in May – up 0.2% from a level of 99.5 in April. Despite rising for the second consecutive month, May represented the 10th time in the last 11 months that the current situation component stood below 100 in contraction territory.
The Expectations Index, which measures restaurant operators’ six-month outlook for four industry indicators, stood at 100.4, up 0.3% from the previous month. That followed two straight declines in the RPI’s forward-looking component and was driven by an improvement in operators’ sentiment about the economy.
RPI Methodology
The National Restaurant Association's Restaurant Performance Index (RPI) is a monthly composite index that tracks the health of the U.S. restaurant industry. Launched in 2002, the RPI is released on the last business day of each month.
The RPI is measured in relation to a neutral level of 100. Index values above 100 indicate that key industry indicators are in a period of expansion, while index values below 100 represent a period of contraction for key industry indicators. The Index consists of two components — the Current Situation Index, which measures current trends in four industry indicators (same-store sales, traffic, labor and capital expenditures), and the Expectations Index, which measures restaurant operators’ six-month outlook for four industry indicators (same-store sales, employees, capital expenditures and business conditions).
The RPI is based on the responses to the National Restaurant Association’s Restaurant Industry Tracking Survey, which is fielded monthly among restaurant operators nationwide on a variety of indicators including sales, traffic, labor and capital expenditures. Restaurant operators interested in participating in the tracking survey: contact Bruce Grindy.
Updated 6/29/2026