Research
July 16, 2026
Total restaurant industry sales
Restaurant sales trended higher in recent months, despite elevated gas prices
Consumer spending held up relatively well across most retail categories in recent months, despite the continuation of elevated gasoline prices. Restaurants were among the sectors experiencing growth, which illustrates consumers’ ongoing prioritization of experiences and socialization in their spending decisions.
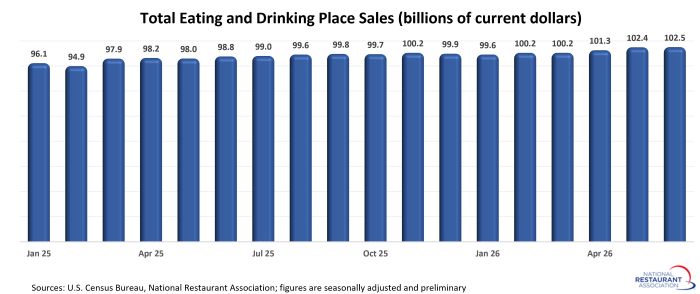
Eating and drinking places registered total sales of $102.5 billion on a seasonally adjusted basis in June, according to preliminary data from the U.S. Census Bureau. That was up slightly from May’s sales volume of $102.4 billion.
June represented the fourth sales increase in the last five months, with April and May readings getting revised significantly higher. The fact that consumer spending in restaurants continued to rise is a positive sign, as the added wallet competition from elevated gas prices has been substantial.
Although pump prices retreated somewhat from the recent highs reached in May, they remain nearly a dollar above where they were in late February. Two factors that helped support consumer spending were larger tax refunds and the resilience of the U.S. labor market. Both will need to keep playing their part for consumers to continue weathering this period of elevated gas prices.
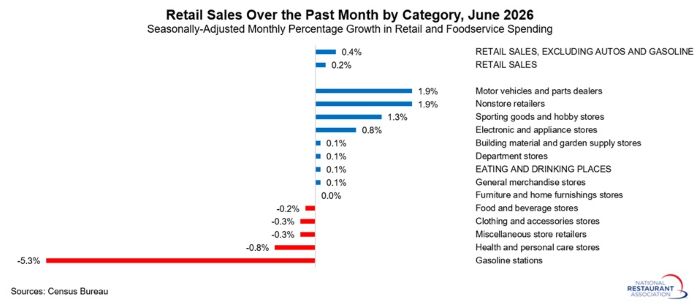
Although restaurant sales registered a modest gain in June, consumers ramped up spending in other areas. That was buoyed by a 5.3% decline in sales at gasoline stations, a result that was largely the result of falling pump prices.
Sales growth in other retail categories were led by non-store retailers (+1.9%), motor vehicles and parts dealers (+1.9%), sporting goods and hobby stores (+1.3%) and electronics and appliance stores (+0.8%). Overall, total retail sales excluding gas stations were up a solid 0.7% in June.
While rising menu prices continue to boost nominal sales growth, the industry is seeing mixed results on an inflation-adjusted basis. Although real eating and drinking place sales were up 0.4% from year-ago levels in June, the trendline was relatively flat for the last several months.
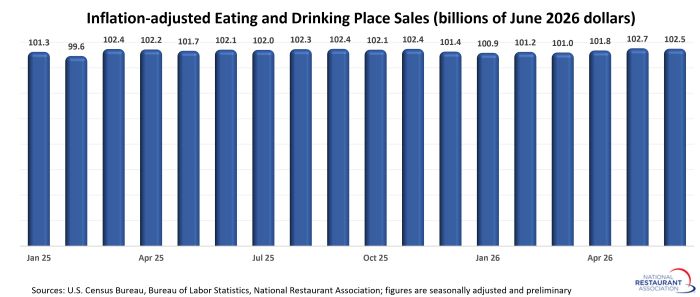
Note: Eating and drinking places are the primary component of the U.S. restaurant and foodservice industry and represent approximately 72% of total restaurant and foodservice sales.
Eating and drinking places registered total sales of $102.5 billion on a seasonally adjusted basis in June, according to preliminary data from the U.S. Census Bureau. That was up slightly from May’s sales volume of $102.4 billion.
June represented the fourth sales increase in the last five months, with April and May readings getting revised significantly higher. The fact that consumer spending in restaurants continued to rise is a positive sign, as the added wallet competition from elevated gas prices has been substantial.
Although pump prices retreated somewhat from the recent highs reached in May, they remain nearly a dollar above where they were in late February. Two factors that helped support consumer spending were larger tax refunds and the resilience of the U.S. labor market. Both will need to keep playing their part for consumers to continue weathering this period of elevated gas prices.
Although restaurant sales registered a modest gain in June, consumers ramped up spending in other areas. That was buoyed by a 5.3% decline in sales at gasoline stations, a result that was largely the result of falling pump prices.
Sales growth in other retail categories were led by non-store retailers (+1.9%), motor vehicles and parts dealers (+1.9%), sporting goods and hobby stores (+1.3%) and electronics and appliance stores (+0.8%). Overall, total retail sales excluding gas stations were up a solid 0.7% in June.
While rising menu prices continue to boost nominal sales growth, the industry is seeing mixed results on an inflation-adjusted basis. Although real eating and drinking place sales were up 0.4% from year-ago levels in June, the trendline was relatively flat for the last several months.
Note: Eating and drinking places are the primary component of the U.S. restaurant and foodservice industry and represent approximately 72% of total restaurant and foodservice sales.