Menu Prices
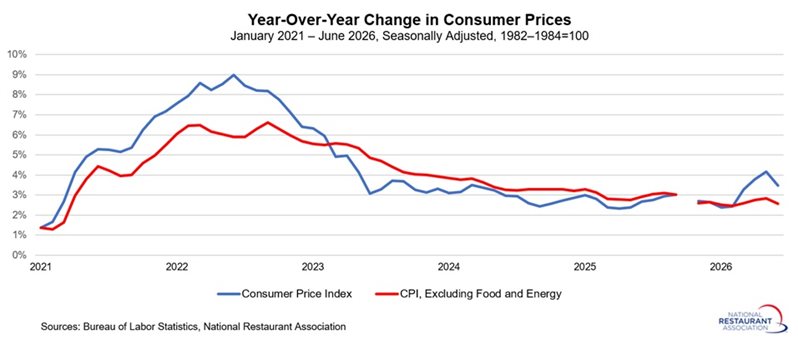
Core CPI, which excludes food and energy, was unchanged in June after rising 0.2% in May. On a 12-month basis, core inflation slowed from 2.8% in May to 2.6% in June. The underlying data pointed to broader pricing relief, with declines in apparel (-0.6%), transportation services (-0.3%), used cars and trucks (-0.2%), household furnishings and supplies (-0.1%), and medical care services (-0.1%). In contrast, shelter costs edged up 0.1%, while new vehicle prices were unchanged.
The moderation in inflation during June is certainly welcome, particularly after inflation had moved in the wrong direction earlier this year. However, much of the improvement reflected lower energy costs. With tensions in the Middle East still unresolved, gasoline prices could move higher again in July. Consequently, the Federal Reserve is likely to remain focused on inflation pressures that continue to run above its long-term target.
At the same time, the labor market and broader economy have remained relatively resilient despite elevated uncertainty among consumers and businesses. Nevertheless, inflation remains uncomfortably high, even with June’s softer reading. As a result, the Federal Open Market Committee is expected to keep monetary policy unchanged in the near term. Interest rate cuts appear unlikely in the coming months, and speculation has grown that policymakers could consider additional rate hikes later this year if inflation fails to make significant progress lower.
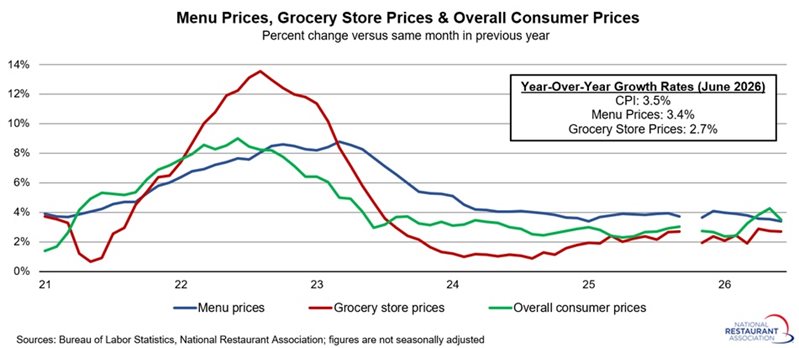
Grocery store prices have outpaced menu price growth year-to-date
Menu prices increased 0.2% in June, easing modestly from the 0.3% gain recorded in May. Through the first six months of 2026, restaurant menu prices have risen at an average monthly rate of 0.2%. On a year-over-year basis, menu prices were 3.4% higher than in June 2025, representing the slowest annual increase in 17 months. While restaurant inflation remains elevated by historical standards, it has continued to moderate and remains well below the 8.8% peak reached in March 2023, the fastest pace of menu price growth in more than two decades.
Grocery prices also increased 0.2% in June, accelerating slightly from a 0.1% gain in May. On average, food-at-home prices have risen 0.3% per month during the first half of 2026, outpacing the rate of restaurant price increases. Over the past 12 months, grocery prices have advanced 2.7%.
For the restaurant industry, a notable development has been the narrowing gap between grocery and menu price inflation. While dining out remains more inflationary than eating at home, the difference has shrunk considerably so far this year. That trend could help support restaurant demand, as the relative cost advantage of purchasing food from grocery stores has become less pronounced, potentially making consumers more willing to spend on away-from-home meals.
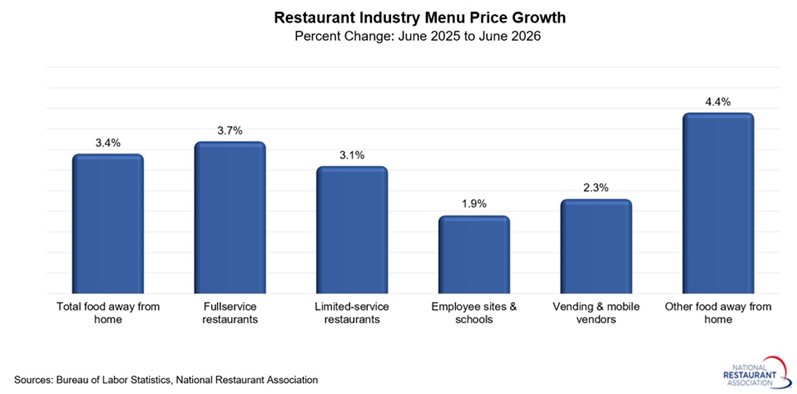
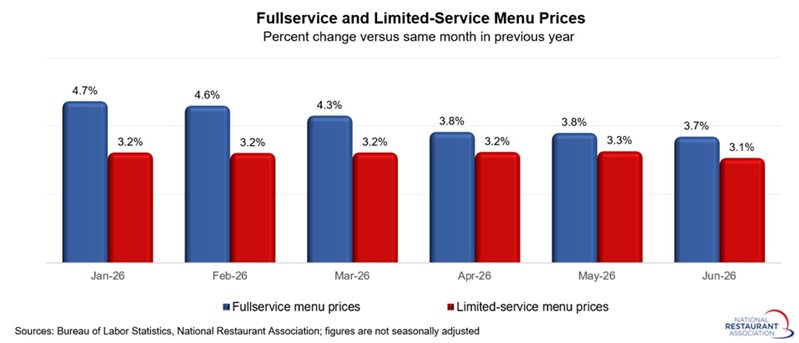
In the food away from home category, menu prices at fullservice restaurants rose 0.4% in June, building on the 0.3% gain seen in May. Through the first six months of this year, fullservice menu prices have averaged 0.2% growth per month. Meanwhile, menu prices at limited-service establishments edged up 0.1% in June following solid gains in prior months, with an average month growth of 0.3% in the first half of 2026. On a year-on-year basis, fullservice restaurant menu prices grew 3.7% since June 2025, with 3.1% growth year-on-year for limited-service businesses.
Within the broader food-away-from-home category, prices at employee sites and schools jumped 0.9% in June after being unchanged in May. In contrast, prices for food from vending machines and mobile vendors inched down 0.1% in June, following a gain of 0.4% in May. Menu prices for other food away from home rose 0.3% in June.
Despite the month-to-month volatility, menu prices at employee sites and schools rose 0.3% per month on average year-to-date, with prices for food from vending machines and mobile vendors up 0.2% on average monthly through the first half of 2026.
Year-over-year, prices at employee sites and schools rose 1.9% since June 2025, with prices at vending and mobile vendors up 2.3%. The broader “other food away from home” category posted a 4.4% annual increase in prices in May year-over-year.