Research
June 18, 2026
Consumer confidence
Consumers are weathering the storm of high gas prices
While still less than ideal, the environment for consumers improved somewhat in recent weeks. The national average for a gallon of regular gasoline, which has been above $4 for nearly three months, is down about 50 cents from its mid-May peak. The recent agreement to reopen the Strait of Hormuz increases the likelihood that pump prices will continue to trend lower in the weeks ahead.
On top of that is a resurgence in the U.S. labor market, which returned to the fore to provide a boost to jittery consumers. Employers added more than a half-million jobs during the past three months – a pace of payroll expansion not seen in more than two years. That kept the unemployment rate historically low at 4.3%, which suggests that the labor market remains in balance.
Through it all, consumers have maintained their appetite to spend – and not just at gasoline stations. The Census Bureau’s May retail sales report showed continued strength across several sectors, even as restaurant sales took a pause from their recent upward trajectory.
Household balance sheets on the aggregate remain relatively healthy as well. Although debt levels continue to rise, they remain manageable when compared to disposable income. Household wealth also continues to trend higher, which buoys the spending of consumers with homes and investments.
Overall, recent trends in some key indicators suggest that consumers may have weathered the storm of high gas prices. While risks to the outlook remain significant, it is likely that consumers on the aggregate will maintain their willingness and ability to continue spending in 2026.
This article presents the latest trends in key indicators that impact consumer activity. Visit this page throughout the year for ongoing analysis of the state of the American consumer.
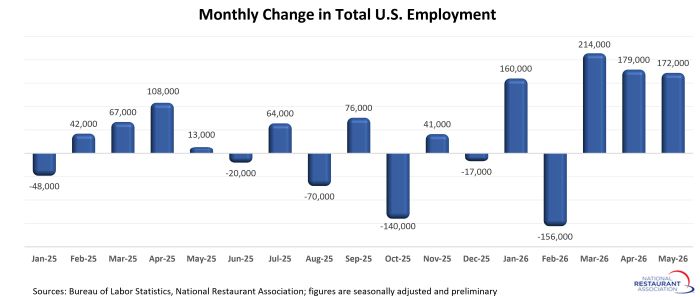
Job growth roared back in recent months
Employers added more than a half-million jobs during the last 3 months, which represented the strongest payroll expansion in more than 2 years. That followed an extended stretch of choppy job growth, with the economy alternating between sizable gains and declines on a month-to-month basis. The net increase of 565,000 jobs during the last 3 months was a solid improvement from the 50,000 jobs lost during the previous 10 months.
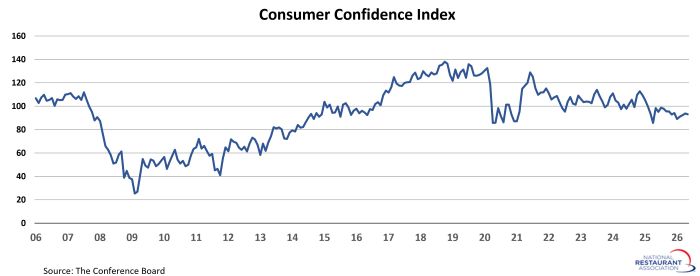
Consumer confidence rebounded from recent lows
Coinciding with the choppy labor market performance in 2025, The Conference Board’s Consumer Confidence Index showed signs of rising economic uncertainty among households. This measure of consumer sentiment trended steadily lower into 2026, before rebounding slightly in recent months. The downward trend was largely due to declines in the expectations component of the index, which measures consumers’ short-term outlook for income, business, and labor market conditions. Despite the recent reacceleration in job growth, consumers’ assessment of economic conditions remains muted.
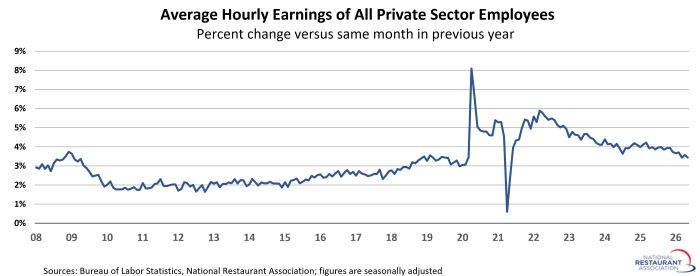
Wage growth slowed in recent months
In contrast to the robust job growth in recent months, wage growth slowed. Average hourly earnings of private sector employees increased 3.4% between May 2025 and May 2026. That was more than 2 percentage points below the strong gains posted during 2022. Despite the recent slowdown, wage growth remained slightly above the 3.3% average increase during 2019.
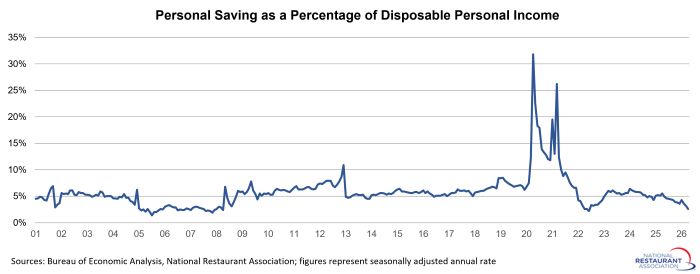
Savings rate declined in recent months
Along with decelerating wage gains, the uptick in inflation means consumers are seeing little to no income growth in inflation-adjusted terms. To support continued spending, many households are tapping into their savings to support their expenditures. That led to the personal savings rate falling to 2.6% in April, which was the lowest level since mid-2022. It was also well below the pre-pandemic savings rate, which averaged 6.5% between 2017 and 2019.
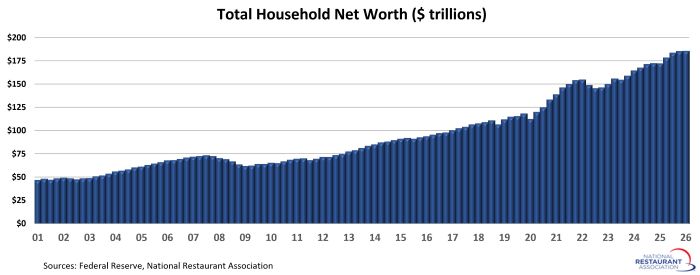
Household wealth surged in recent quarters
Household wealth continues to trend higher, reaching a new record high of $183 trillion in the first quarter of 2026. Total household net worth increased in 9 of the last 10 quarters, a period during which wealth jumped by nearly $31 trillion. During the last 4 quarters alone, household net worth surged more than $13 trillion. That positively impacts consumers’ willingness to spend on discretionary items, including restaurants.
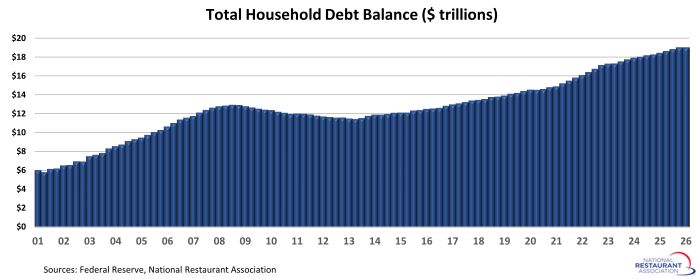
Household debt continues to rise
Household debt trended steadily higher in recent years, with aggregate balances reaching $18.8 trillion by 2026:Q1. Mortgages represent the bulk of household debt at 70%, followed by auto loans (9%), student loans (9%) and credit cards (7%).
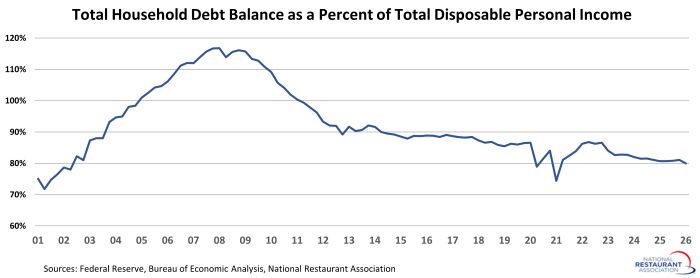
Debt to income ratio remains manageable
Even though debt levels are rising, it remains manageable in relation to income. In the first quarter of 2026, the total household debt balance was 80% of total disposable personal income. Aside from two quarters during the pandemic, that’s the lowest debt-to-income ratio in more than two decades. It’s also well below the record highs of more than 116% registered during the Great Recession in 2007 and 2008.
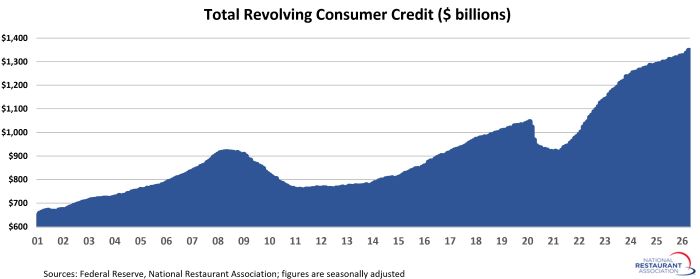
Revolving credit balances continue to rise
Revolving consumer credit rose sharply during the last 5 years, following an early-pandemic period during which balances dropped by more than 12%. By April 2026, total revolving credit balances topped $1.3 trillion, which was $302 billion (or 29%) above their pre-pandemic peak. Total revolving credit balances jumped $22 billion in March and April alone, marking the strongest 2-month increase in more than 2 years.
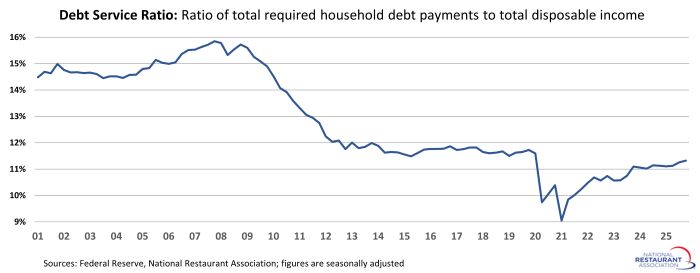
Debt service remains in check
Despite the elevated debt levels, debt service remains manageable for households on the aggregate. The Federal Reserve’s Debt Service Ratio, which is the ratio of total required household debt payments to total disposable income, was just over 11% in 2025:Q4. While that was higher than the lows posted during the first half of 2021, it remained slightly below pre-pandemic readings.
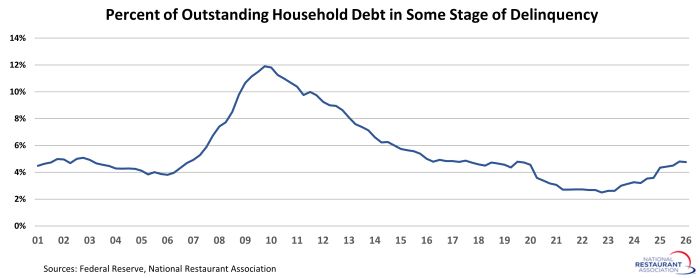
Overall delinquency rates are trending higher
While debt service levels remained manageable in historical terms, overall delinquency rates trended higher in recent quarters. As of 2026:Q1, just under 4.8% of outstanding household debt was in some stage of delinquency. That was down slightly from the 2025:Q4 level, and followed six consecutive quarters of rising delinquency rates. Still, it was up more than 2 full percentage points from the recent low of 2.5% in 2022:Q4, and remained near the highest level since 2017:Q3 (4.9%).
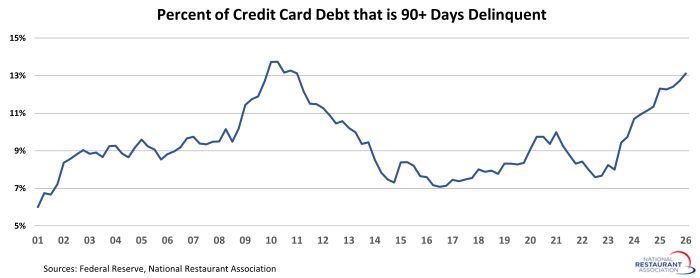
Credit card delinquencies are up sharply
Along with the recent rise in overall delinquency rates, the percentage of credit cards that were severely delinquent trended sharply higher in recent quarters. As of 2026:Q1, 13.1% of credit card debt was at least 90 days delinquent. That was up from a recent low of 7.6% in 2022:Q3 and represented the highest level in 15 years.
On top of that is a resurgence in the U.S. labor market, which returned to the fore to provide a boost to jittery consumers. Employers added more than a half-million jobs during the past three months – a pace of payroll expansion not seen in more than two years. That kept the unemployment rate historically low at 4.3%, which suggests that the labor market remains in balance.
Through it all, consumers have maintained their appetite to spend – and not just at gasoline stations. The Census Bureau’s May retail sales report showed continued strength across several sectors, even as restaurant sales took a pause from their recent upward trajectory.
Household balance sheets on the aggregate remain relatively healthy as well. Although debt levels continue to rise, they remain manageable when compared to disposable income. Household wealth also continues to trend higher, which buoys the spending of consumers with homes and investments.
Overall, recent trends in some key indicators suggest that consumers may have weathered the storm of high gas prices. While risks to the outlook remain significant, it is likely that consumers on the aggregate will maintain their willingness and ability to continue spending in 2026.
This article presents the latest trends in key indicators that impact consumer activity. Visit this page throughout the year for ongoing analysis of the state of the American consumer.
Job growth roared back in recent months
Employers added more than a half-million jobs during the last 3 months, which represented the strongest payroll expansion in more than 2 years. That followed an extended stretch of choppy job growth, with the economy alternating between sizable gains and declines on a month-to-month basis. The net increase of 565,000 jobs during the last 3 months was a solid improvement from the 50,000 jobs lost during the previous 10 months.
Consumer confidence rebounded from recent lows
Coinciding with the choppy labor market performance in 2025, The Conference Board’s Consumer Confidence Index showed signs of rising economic uncertainty among households. This measure of consumer sentiment trended steadily lower into 2026, before rebounding slightly in recent months. The downward trend was largely due to declines in the expectations component of the index, which measures consumers’ short-term outlook for income, business, and labor market conditions. Despite the recent reacceleration in job growth, consumers’ assessment of economic conditions remains muted.
Wage growth slowed in recent months
In contrast to the robust job growth in recent months, wage growth slowed. Average hourly earnings of private sector employees increased 3.4% between May 2025 and May 2026. That was more than 2 percentage points below the strong gains posted during 2022. Despite the recent slowdown, wage growth remained slightly above the 3.3% average increase during 2019.
Savings rate declined in recent months
Along with decelerating wage gains, the uptick in inflation means consumers are seeing little to no income growth in inflation-adjusted terms. To support continued spending, many households are tapping into their savings to support their expenditures. That led to the personal savings rate falling to 2.6% in April, which was the lowest level since mid-2022. It was also well below the pre-pandemic savings rate, which averaged 6.5% between 2017 and 2019.
Household wealth surged in recent quarters
Household wealth continues to trend higher, reaching a new record high of $183 trillion in the first quarter of 2026. Total household net worth increased in 9 of the last 10 quarters, a period during which wealth jumped by nearly $31 trillion. During the last 4 quarters alone, household net worth surged more than $13 trillion. That positively impacts consumers’ willingness to spend on discretionary items, including restaurants.
Household debt continues to rise
Household debt trended steadily higher in recent years, with aggregate balances reaching $18.8 trillion by 2026:Q1. Mortgages represent the bulk of household debt at 70%, followed by auto loans (9%), student loans (9%) and credit cards (7%).
Debt to income ratio remains manageable
Even though debt levels are rising, it remains manageable in relation to income. In the first quarter of 2026, the total household debt balance was 80% of total disposable personal income. Aside from two quarters during the pandemic, that’s the lowest debt-to-income ratio in more than two decades. It’s also well below the record highs of more than 116% registered during the Great Recession in 2007 and 2008.
Revolving credit balances continue to rise
Revolving consumer credit rose sharply during the last 5 years, following an early-pandemic period during which balances dropped by more than 12%. By April 2026, total revolving credit balances topped $1.3 trillion, which was $302 billion (or 29%) above their pre-pandemic peak. Total revolving credit balances jumped $22 billion in March and April alone, marking the strongest 2-month increase in more than 2 years.
Debt service remains in check
Despite the elevated debt levels, debt service remains manageable for households on the aggregate. The Federal Reserve’s Debt Service Ratio, which is the ratio of total required household debt payments to total disposable income, was just over 11% in 2025:Q4. While that was higher than the lows posted during the first half of 2021, it remained slightly below pre-pandemic readings.
Overall delinquency rates are trending higher
While debt service levels remained manageable in historical terms, overall delinquency rates trended higher in recent quarters. As of 2026:Q1, just under 4.8% of outstanding household debt was in some stage of delinquency. That was down slightly from the 2025:Q4 level, and followed six consecutive quarters of rising delinquency rates. Still, it was up more than 2 full percentage points from the recent low of 2.5% in 2022:Q4, and remained near the highest level since 2017:Q3 (4.9%).
Credit card delinquencies are up sharply
Along with the recent rise in overall delinquency rates, the percentage of credit cards that were severely delinquent trended sharply higher in recent quarters. As of 2026:Q1, 13.1% of credit card debt was at least 90 days delinquent. That was up from a recent low of 7.6% in 2022:Q3 and represented the highest level in 15 years.