Restaurant Performance Index increased 0.3% in August
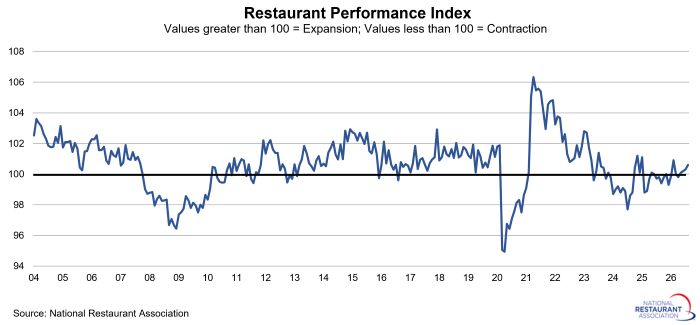
The National Restaurant Association’s Restaurant Performance Index (RPI) rose for the fourth consecutive month in August, largely because of improvements in both same-store sales and customer traffic. The RPI – a monthly index that tracks the health of the U.S. restaurant industry – stood at 100.6 in August, up 0.3% from July and the highest reading since February.
A majority of restaurant operators reported an increase in same-store sales in August, while customer traffic levels were a mixed bag. Looking ahead, 44% of operators think their sales will be higher in six months. That represented the strongest reading since the February 2025 survey period.
The Current Situation Index, which measures current trends in four industry indicators, stood at 100.6 in August – up 0.5% from a level of 100.1 in July. August represented the highest reading since February and the third consecutive month that the current situation component was above 100 in expansion territory.
The Expectations Index, which measures restaurant operators’ six-month outlook for four industry indicators, rose 0.1% to a level of 100.6. Restaurant operators are somewhat more optimistic about sales growth in the months ahead, though they remain uncertain about the direction of the economy.
RPI Methodology
The National Restaurant Association's Restaurant Performance Index (RPI) is a monthly composite index that tracks the health of the U.S. restaurant industry. Launched in 2002, the RPI is released on the last business day of each month.
The RPI is measured in relation to a neutral level of 100. Index values above 100 indicate that key industry indicators are in a period of expansion, while index values below 100 represent a period of contraction for key industry indicators. The Index consists of two components — the Current Situation Index, which measures current trends in four industry indicators (same-store sales, traffic, labor and capital expenditures), and the Expectations Index, which measures restaurant operators’ six-month outlook for four industry indicators (same-store sales, employees, capital expenditures and business conditions).
The RPI is based on the responses to the National Restaurant Association’s Restaurant Industry Tracking Survey, which is fielded monthly among restaurant operators nationwide on a variety of indicators including sales, traffic, labor and capital expenditures. Restaurant operators interested in participating in the tracking survey: contact Bruce Grindy.
Updated 9/30/2026