Total restaurant industry jobs
Restaurant job growth stalled in the second quarter
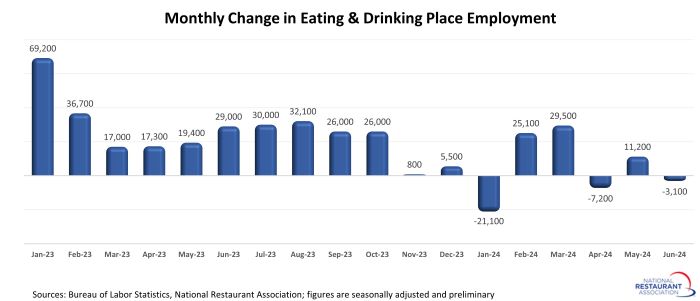
Restaurant employment declined for the second time in the last three months, as the recent softer sales readings appear to be impacting the labor market.
Eating and drinking places* cut a net 3,100 jobs in June on a seasonally-adjusted basis, according to preliminary data from the Bureau of Labor Statistics (BLS). That followed downward-revised readings in both April (-7,200) and May (+11,200).
In total during the 2nd quarter, eating and drinking places added just 900 jobs. That represented the weakest quarterly employment performance since the 4th quarter of 2020, when the industry shed more than 285,000 jobs in the face of the delta variant of COVID-19.
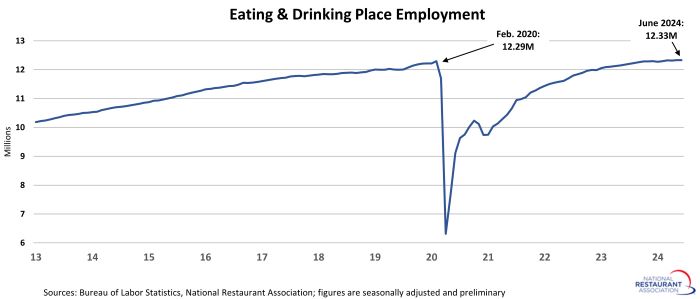
Despite the recent slowdown, the industry workforce remains slightly above pre-pandemic levels. As of June 2024, eating and drinking places were nearly 36,000 jobs (or 0.3%) above their February 2020 employment peak.
Labor market may be normalizing
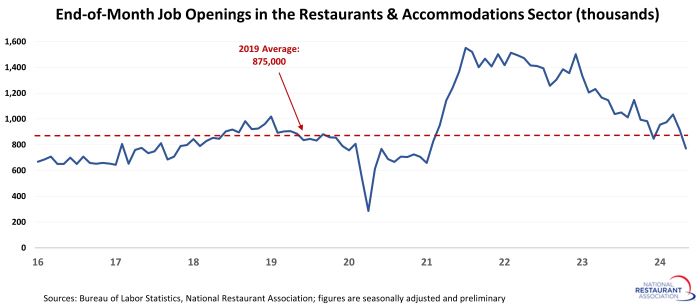
Looking beyond the headline numbers reveal labor market dynamics that are more in line with pre-pandemic conditions. There were fewer than 800,000 job openings in the combined restaurants and accommodations sector on the last business day of May, according to preliminary data from the Bureau of Labor Statistics’ Job Openings and Labor Turnover Survey (JOLTS).
That represented the lowest reading in more than 3 years, and was well below the record highs of more than 1.5 million openings registered several months during 2021 and 2022. It was also slightly below 2019’s average monthly level of 875,000 job openings.
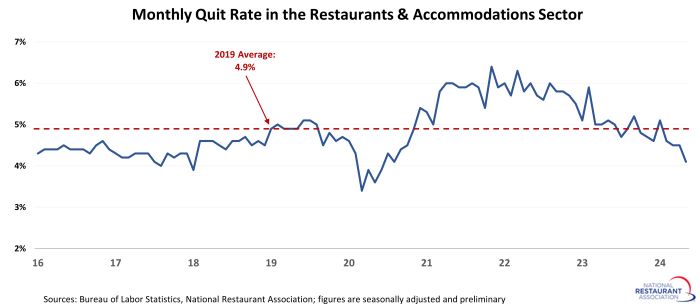
One reason for the downward trend in job openings may be a reduction in the churn rate of existing employees.
Only 4.1% of employees in the combined restaurants and accommodations sector quit their jobs in May, according to BLS. That marked the 4th consecutive month below 5%, and was well below 2019’s average monthly quit rate of 4.9%.
Note: The job openings and quits data presented above are for the broadly-defined Accommodations and Food Services sector (NAICS 72), because the Bureau of Labor Statistics does not report data for restaurants alone. Eating and drinking places account for nearly 90% of jobs in the combined sector.
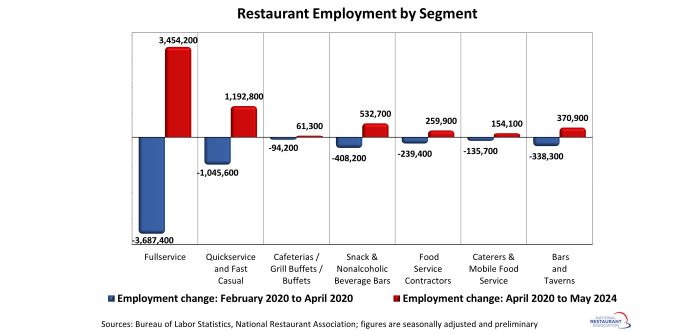
Fullservice segment still down 233k jobs
The fullservice segment experienced the most job losses during the initial months of the pandemic – and it still has the longest path to recovery. As of May 2024, fullservice restaurant employment levels were 233,000 jobs (or 4%) below pre-pandemic readings in February 2020.
Employment counts in the cafeterias/grill buffets/buffets segment (-30%) also remained below their February 2020 levels.
Job losses in the limited-service segments were somewhat less severe during the initial months of the pandemic, as these operations were more likely to retain staff to support their existing off-premises business. As of May 2024, employment at snack and nonalcoholic beverage bars – including coffee, donut and ice cream shops – was nearly 125,000 jobs (or 15%) above February 2020 readings.
Staffing levels in the quickservice and fast casual segments were nearly 150,000 jobs (or 3%) above pre-pandemic levels. Headcounts at bars and taverns were 33,000 jobs (or 8%) above the pre-pandemic peak.
[Note that the segment-level employment figures are lagged by one month, so May is the most current data available.]
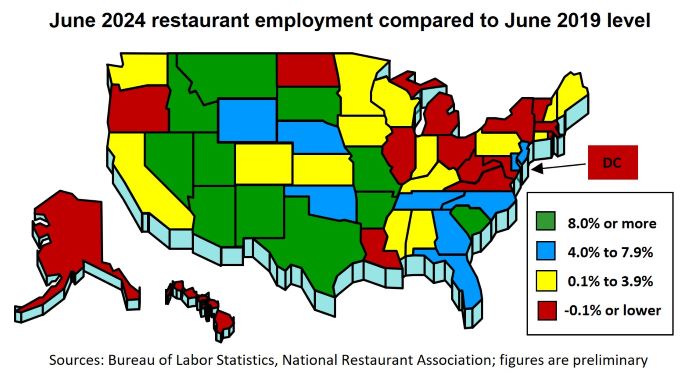
Restaurant employment trends vary across states
Restaurant employment trended higher in recent months, but the extent of the industry’s workforce recovery varies significantly by state. As of June 2024, 15 states and the District of Columbia had fewer eating and drinking place jobs than they did in June 2019.
This group was led by Maryland, Louisiana and North Dakota, which had 6% fewer eating and drinking place jobs in June 2024 than they did in June 2019. Hawaii (-5%), DC (-4%), Illinois (-3%) and Alaska (-3%) were also among the states below their pre-pandemic restaurant employment levels.
As of June 2024, eating and drinking place employment in 35 states surpassed their comparable pre-pandemic readings in June 2019. This group was led by South Dakota (+18%), Nevada (+15%), Utah (+14%), Idaho (+11%) and Texas (+10%).
View the latest employment data for every state.
[Note that the state-level analysis uses June 2019 as the pre-pandemic comparison instead of February 2020, because seasonally-adjusted employment figures are not available.]
*Eating and drinking places are the primary component of the total restaurant and foodservice industry, providing jobs for roughly 80% of the total restaurant and foodservice workforce of 15.5 million.
Track more economic indicators and read more analysis and commentary from the Association's economists.