Research
September 15, 2026
Higher-income households continue to drive restaurant sales
The number of households with income above $100k surged by over 7 million during the last 3 years.
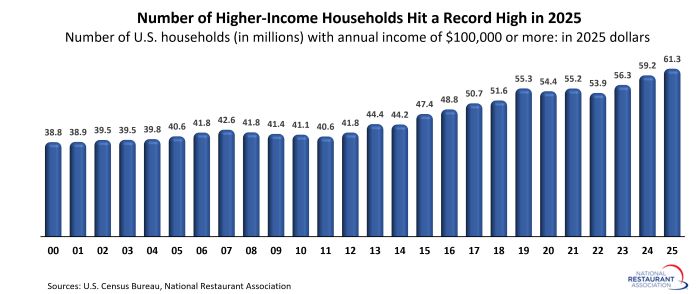
Higher-income households were key drivers of growth in the restaurant industry in recent years – a development that was largely due to the fact that these households surged to record numbers. There were 61.3 million households with annual income of $100,000 or more in 2025, according to data from the U.S. Census Bureau.
That was an increase of 7.4 million households from 2022 (on an inflation-adjusted basis), when households with income of $100,000+ numbered 53.9 million.
The recent upward trend was important, because the number of higher-income households dipped during the pandemic. After peaking at 55.3 million in 2019, the number of households with income in the $100,000+ category declined to 53.9 million by 2022 (on an inflation-adjusted basis).
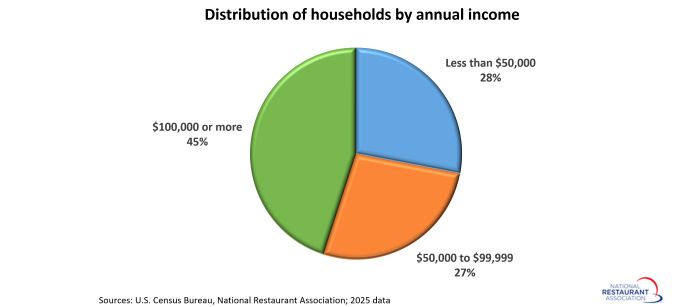
Higher-income households now make up a larger share of total households than they ever have. Households with income above $100,000 represented 45% of all households in 2025 – the highest proportion on record.
In comparison, the 39.2 million households with annual income below $50,000 represented 28% of all households in 2025, while the 36.6 million households in the $50,000-to-$99,999 income range made up 27% of the total.
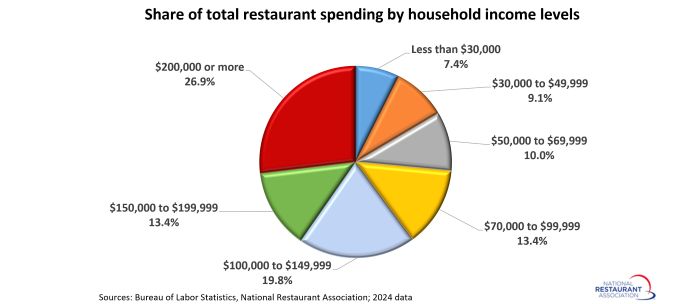
Steady growth in the number of higher-income households is good news for restaurants, as this cohort represents the majority of spending in the industry. According to data from the Bureau of Labor Statistics, households with incomes of $200,000 or higher are responsible for 27% of the total spending on food away from home, while households with incomes between $100,000 and $199,999 account for 33% of industry spending.
Overall, households with income above $100,000 are responsible for fully 6 in 10 dollars spent in the restaurant industry. That despite representing only 45% of all households in the United States.
If the upward trend in higher-income households continues, it bodes well for restaurant sales growth in the coming years.
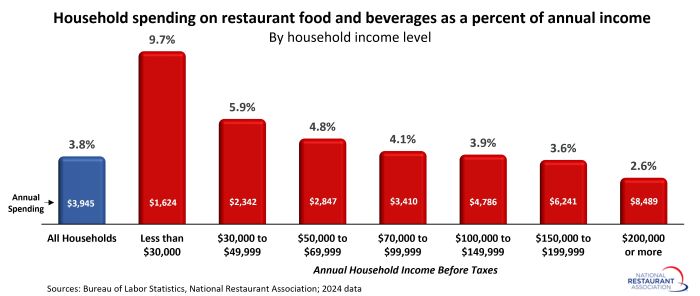
Higher-income households also spend the most at restaurants on a per capita basis, yet it still only represents a small proportion of their annual income.
Among households with annual income of $200,000 or more, spending on restaurant food and beverages represented just 2.6% of their pre-tax income in 2024. Average restaurant spending by households in the $100,000-to-$199,999 range was less than 4% of their pre-tax income.
Given the relatively small share of outlays currently allocated toward food away from home, it is likely that the restaurant spending potential of higher-income households has even more room to run in the years ahead.
That was an increase of 7.4 million households from 2022 (on an inflation-adjusted basis), when households with income of $100,000+ numbered 53.9 million.
The recent upward trend was important, because the number of higher-income households dipped during the pandemic. After peaking at 55.3 million in 2019, the number of households with income in the $100,000+ category declined to 53.9 million by 2022 (on an inflation-adjusted basis).
Higher-income households now make up a larger share of total households than they ever have. Households with income above $100,000 represented 45% of all households in 2025 – the highest proportion on record.
In comparison, the 39.2 million households with annual income below $50,000 represented 28% of all households in 2025, while the 36.6 million households in the $50,000-to-$99,999 income range made up 27% of the total.
Steady growth in the number of higher-income households is good news for restaurants, as this cohort represents the majority of spending in the industry. According to data from the Bureau of Labor Statistics, households with incomes of $200,000 or higher are responsible for 27% of the total spending on food away from home, while households with incomes between $100,000 and $199,999 account for 33% of industry spending.
Overall, households with income above $100,000 are responsible for fully 6 in 10 dollars spent in the restaurant industry. That despite representing only 45% of all households in the United States.
If the upward trend in higher-income households continues, it bodes well for restaurant sales growth in the coming years.
Higher-income households also spend the most at restaurants on a per capita basis, yet it still only represents a small proportion of their annual income.
Among households with annual income of $200,000 or more, spending on restaurant food and beverages represented just 2.6% of their pre-tax income in 2024. Average restaurant spending by households in the $100,000-to-$199,999 range was less than 4% of their pre-tax income.
Given the relatively small share of outlays currently allocated toward food away from home, it is likely that the restaurant spending potential of higher-income households has even more room to run in the years ahead.