Research
March 27, 2026
Slowing population growth has implications for restaurant sales
States in the southeast and mountain west are leading the way in population gains.
It’s been said that demographics are destiny for the restaurant business. Being located in an area with a growing population means not only an expanding base of potential customers, but also a deeper labor pool from which to recruit a talented team.
Population also typically rises in tandem with a healthy economy, as people often relocate to where the jobs are. Taken together, population and economic growth are the most important drivers of restaurant sales.
New data from the U.S. Census Bureau illustrate the latest population dynamics across the states, including the underlying factors that are driving these trends.
For restaurant operators looking to expand their business, keeping a close eye on these emerging demographic trends can help improve their chances of success.
Population growth slowed in 2025
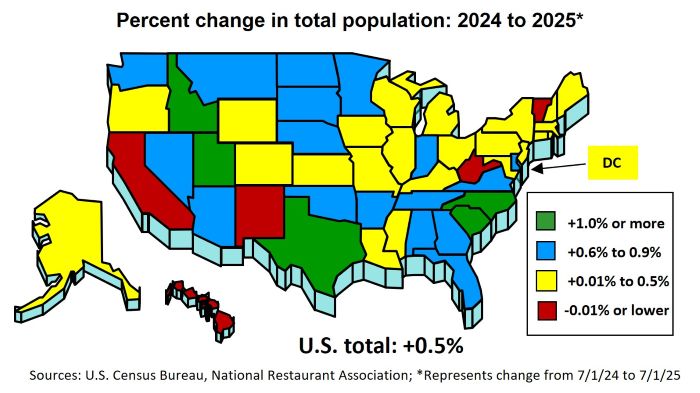
The U.S. population grew by nearly 1.8 million between July 1, 2024 and July 1, 2025 – an increase of 0.5%. That was down from a 1.0% gain (3.2 million people) during the previous 12-month period, which represented the strongest annual growth rate since 2006.
On the state level, South Carolina led the way with a robust 1.5% population increase – or three times faster than the national average. Other states with healthy population gains included Idaho (1.4%), North Carolina (1.3%), Texas (1.2%) and Utah (1.0%).
At the other end of the spectrum, five states experienced modest population declines in 2025: Vermont (-0.3%), Hawaii (-0.1%), West Virginia (-0.1%), New Mexico (-0.1%) and California (-0.02%).
Shifts in population result from three factors: natural change (births and deaths), domestic migration (people moving between states) and international migration (people moving in and out of the country).
The sections below show how states fared across each of those components between 2024 and 2025. Click here for the full data in the four maps.
Natural change
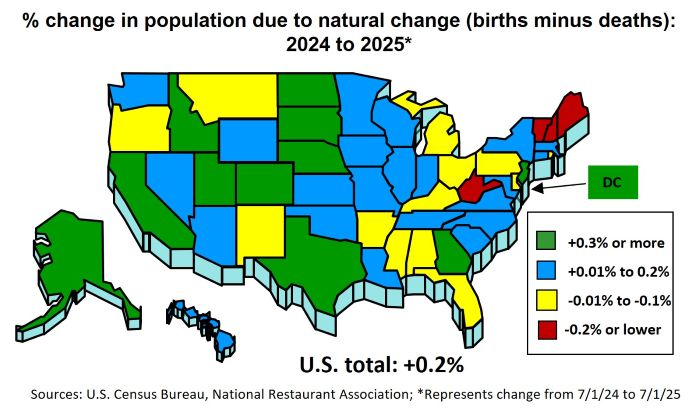
Nationally, there were approximately 3.6 million births and 3.1 million deaths during the 12-month period between July 1, 2024 and July 1, 2025. That net increase of roughly 500,000 people was similar to the previous two years, and represented nearly 30% of the total U.S. population growth last year. By itself, that natural change would have increased the total U.S. population by about 0.2%.
Population growth due to natural change varied significantly on the state level last year. Utah (0.7%), Texas (0.5%), Alaska (0.4%) and the District of Columbia (0.4%) saw the largest population gains due to natural change.
In contrast, 17 states had a negative contribution to population due to natural change, meaning the number of deaths was larger than the number of births. The states with the largest population declines due to natural change were West Virginia (-0.4%), Maine (-0.4%), Vermont (-0.3%) and New Hampshire (-0.2%).
Even though South Carolina had the largest 2025 population increase at 1.5%, very little of it was due to natural change. South Carolina’s births outnumbered deaths by only 564 people last year, which by itself would have increased the state’s population by less than 0.1%.
Domestic migration
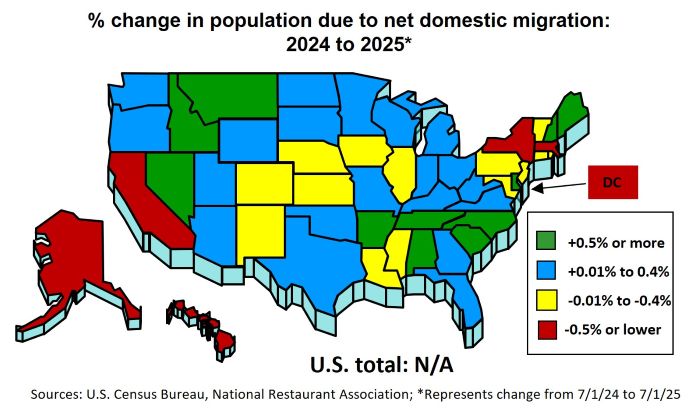
The largest driver of regional population shifts in the U.S. is domestic migration, which is when people move from one state to another. Overall, 31 states experienced positive net domestic migration in 2025, while 19 states and the District of Columbia saw more people move out than move in.
South Carolina (1.2%), Idaho (1.0%), North Carolina (0.8%) and Delaware (0.7%) experienced the largest population growth due to net domestic migration last year.
States with the largest population declines due to net domestic migration were New York (-0.7%), Hawaii (-0.6%), Alaska (-0.6%), California (-0.6%) and the District of Columbia (-0.6%).
In raw numbers, California (-229,077) and New York (-137,586) had the largest net decline in residents as a result of domestic migration. North Carolina (+84,064), Texas (+67,299), South Carolina (+66,622) and Tennessee (+42,389) had the largest net inflows from other states.
International migration
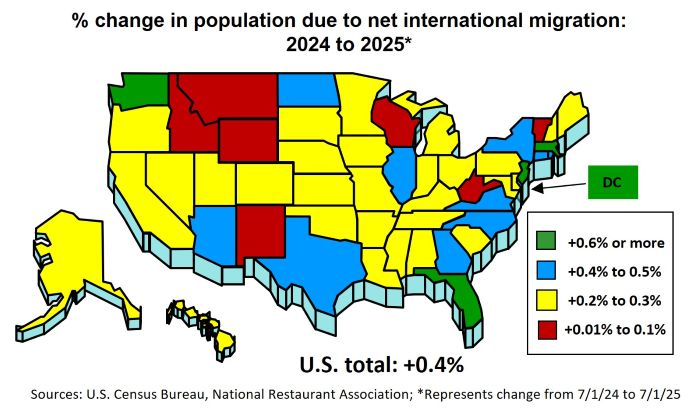
International migration also played an important role in population shifts across the country last year. Unlike the other two components of change, every state’s population was boosted by international migration in 2025.
Overall, the U.S. added nearly 1.3 million people as a result of net international migration between July 1, 2024 and July 1, 2025. That was less than half of the 2.7 million people added during the previous 12-month period, and was the primary reason for the dramatic slowdown in population growth.
Florida (0.8%), Washington (0.6%), Massachusetts (0.6%), New Jersey (0.6%) and the District of Columbia (0.6%) saw the largest population growth due to net international migration last year.
While still positive, states such as West Virginia, Wyoming, Montana and Vermont only saw modest population growth via net international migration.
Florida (+178,674), Texas (+167,475), California (+109,278) and New York (+95,634) had the largest net increase in residents as a result of international migration.
Population also typically rises in tandem with a healthy economy, as people often relocate to where the jobs are. Taken together, population and economic growth are the most important drivers of restaurant sales.
New data from the U.S. Census Bureau illustrate the latest population dynamics across the states, including the underlying factors that are driving these trends.
For restaurant operators looking to expand their business, keeping a close eye on these emerging demographic trends can help improve their chances of success.
Population growth slowed in 2025
The U.S. population grew by nearly 1.8 million between July 1, 2024 and July 1, 2025 – an increase of 0.5%. That was down from a 1.0% gain (3.2 million people) during the previous 12-month period, which represented the strongest annual growth rate since 2006.
On the state level, South Carolina led the way with a robust 1.5% population increase – or three times faster than the national average. Other states with healthy population gains included Idaho (1.4%), North Carolina (1.3%), Texas (1.2%) and Utah (1.0%).
At the other end of the spectrum, five states experienced modest population declines in 2025: Vermont (-0.3%), Hawaii (-0.1%), West Virginia (-0.1%), New Mexico (-0.1%) and California (-0.02%).
Shifts in population result from three factors: natural change (births and deaths), domestic migration (people moving between states) and international migration (people moving in and out of the country).
The sections below show how states fared across each of those components between 2024 and 2025. Click here for the full data in the four maps.
Natural change
Nationally, there were approximately 3.6 million births and 3.1 million deaths during the 12-month period between July 1, 2024 and July 1, 2025. That net increase of roughly 500,000 people was similar to the previous two years, and represented nearly 30% of the total U.S. population growth last year. By itself, that natural change would have increased the total U.S. population by about 0.2%.
Population growth due to natural change varied significantly on the state level last year. Utah (0.7%), Texas (0.5%), Alaska (0.4%) and the District of Columbia (0.4%) saw the largest population gains due to natural change.
In contrast, 17 states had a negative contribution to population due to natural change, meaning the number of deaths was larger than the number of births. The states with the largest population declines due to natural change were West Virginia (-0.4%), Maine (-0.4%), Vermont (-0.3%) and New Hampshire (-0.2%).
Even though South Carolina had the largest 2025 population increase at 1.5%, very little of it was due to natural change. South Carolina’s births outnumbered deaths by only 564 people last year, which by itself would have increased the state’s population by less than 0.1%.
Domestic migration
The largest driver of regional population shifts in the U.S. is domestic migration, which is when people move from one state to another. Overall, 31 states experienced positive net domestic migration in 2025, while 19 states and the District of Columbia saw more people move out than move in.
South Carolina (1.2%), Idaho (1.0%), North Carolina (0.8%) and Delaware (0.7%) experienced the largest population growth due to net domestic migration last year.
States with the largest population declines due to net domestic migration were New York (-0.7%), Hawaii (-0.6%), Alaska (-0.6%), California (-0.6%) and the District of Columbia (-0.6%).
In raw numbers, California (-229,077) and New York (-137,586) had the largest net decline in residents as a result of domestic migration. North Carolina (+84,064), Texas (+67,299), South Carolina (+66,622) and Tennessee (+42,389) had the largest net inflows from other states.
International migration
International migration also played an important role in population shifts across the country last year. Unlike the other two components of change, every state’s population was boosted by international migration in 2025.
Overall, the U.S. added nearly 1.3 million people as a result of net international migration between July 1, 2024 and July 1, 2025. That was less than half of the 2.7 million people added during the previous 12-month period, and was the primary reason for the dramatic slowdown in population growth.
Florida (0.8%), Washington (0.6%), Massachusetts (0.6%), New Jersey (0.6%) and the District of Columbia (0.6%) saw the largest population growth due to net international migration last year.
While still positive, states such as West Virginia, Wyoming, Montana and Vermont only saw modest population growth via net international migration.
Florida (+178,674), Texas (+167,475), California (+109,278) and New York (+95,634) had the largest net increase in residents as a result of international migration.