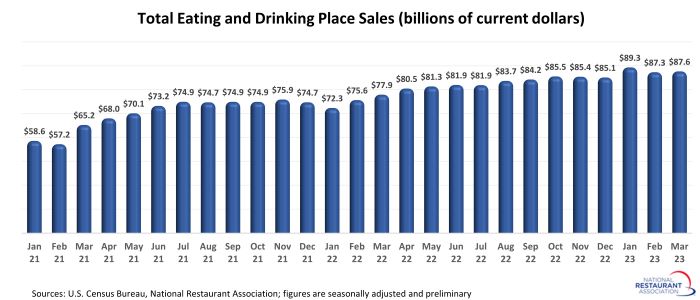
Restaurant sales edged higher in March
[Note: This article was updated on April 26 to incorporate annual data revisions that were released by the U.S. Census Bureau on April 24. While the month-to-month trend in eating and drinking place sales remained generally consistent, the total sales volume was revised significantly lower for each month beginning in December 2020.]
Eating and drinking places* registered total sales of $87.6 billion on a seasonally adjusted basis in March, according to preliminary data from the U.S. Census Bureau. That was up 0.4% from February’s sales volume of $87.3 billion, though it remained well below January’s recent high of $89.3 billion.
While the restaurant sales gain was modest in March, it was a relative bright spot in an otherwise cloudy retail sales report.
Consumer spending in non-restaurant retail sectors fell 0.8% in March – with sharp declines seen at building supply stores (-2.1%), gasoline stations (-1.9%), vehicle dealers (-1.6%), clothing stores (-1.6%) and home furnishing stores (-1.4%).
In total for the first quarter, eating and drinking place sales were 3.2% above the volume registered in the fourth quarter of 2022, on a seasonally adjusted basis. That was more than three times stronger than the 0.9% increase in non-restaurant retail sales during the same period.
Overall consumer spending may be losing momentum, but the latest data suggest the positive trajectory in restaurant sales may be more durable.

*Eating and drinking places are the primary component of the U.S. restaurant and foodservice industry, which prior to the coronavirus pandemic generated approximately 75% of total restaurant and foodservice sales. Monthly sales figures presented above represent total revenues at all eating and drinking place establishments.
Read more analysis and commentary from the Association's chief economist Bruce Grindy.