New Association report helps operators gauge their restaurant performance
In today’s challenging and unpredictable business environment, restaurant operators need to keep a close watch on expenses across their restaurant. The margin of error is often low, and one slip-up can turn profit into a loss.
One tool to help restaurant operators gauge their financial performance is the National Restaurant Association’s 2025 Restaurant Operations Data Abstract. Based on surveys of more than 900 restaurants nationwide, this report contains important data for operators to see how their business compares with similar restaurants.
The report provides data on wide range of expenses – led by the prime cost categories of food and labor. Also included are line items that may not receive as much attention – but are extremely important to a restaurant’s financial health – such as occupancy, utilities, marketing and more.
This information may help sharpen financial performance and quickly identify cost categories where data could substantially vary by type of operation. By analyzing operating costs, restaurant operators can detect potential problems, determine how to manage costs, and become more efficient.
This unique collection of operating data includes specific financial information for the fullservice and limited-service segments. Additionally, the data is presented by key attributes, including average check size, annual sales volume, size of community and restaurant location.
The 2025 edition of the Restaurant Operations Data Abstract is available for purchase on the Association’s store.
Why using data to analyze restaurant performance is important
Periodically analyzing the financial performance of a restaurant’s food and beverage service operations can reveal some early warning signs of potential problems. Food and beverage costs or payroll might be inching up month by month. Some controllable expenses could be increasing, while others are decreasing.
Day-to-day changes in costs might be small and could go unnoticed. However, regular examination can uncover undesirable trends, allowing operators to take corrective action and control situations that could lead to a crisis. That’s the key to effective management.
To help restaurant operators analyze the financial health of their business, the Restaurant Operations Data Abstract contains a worksheet that illustrates how well a restaurant is performing compared with those of a similar business profile.
A look at the bottom line
When all of the cost items are subtracted from a restaurant’s sales, the goal is that something remains in the form of profit.
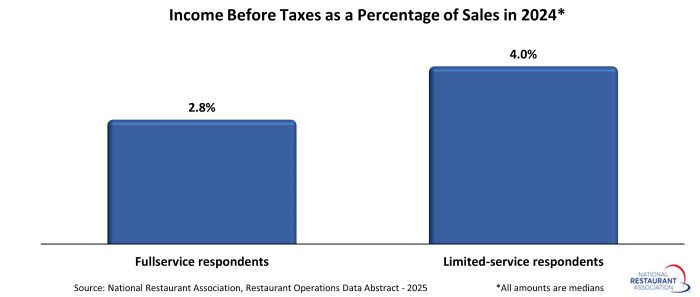
The restaurant industry has historically operated on extremely tight margins, and 2024 was no different. Dampened customer traffic and stubbornly elevated costs combined to keep pressure on the bottom line. The result were modest profit margins – even by restaurant standards.
Among fullservice respondents to the survey, income before taxes represented a median of 2.8% of sales in 2024. For limited-service respondents, income before taxes was a median of 4.0% of sales.
Note: The data in the 2025 Restaurant Operations Data Abstract is not intended to represent standards or goals for individual restaurants, nor is the report an attempt by the National Restaurant Association to set or adjust industry prices or operating ratios. Rather, the data and related ‘Analyze Your Operation’ worksheet are intended to be used as management tools to help operators gauge their restaurant’s performance.