Restaurants continued to retake wallet share in April
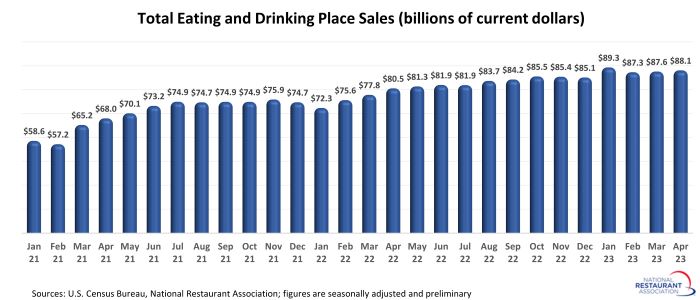
Eating and drinking places* registered total sales of $88.1 billion on a seasonally adjusted basis in April, according to preliminary data from the U.S. Census Bureau. That was up 0.6% from a level of $87.6 billion in March, though it remained well below January’s recent high of $89.3 billion.
Restaurants continued to regain a larger share of consumers’ wallets in April, as total spending in non-restaurant retail sectors rose 0.4%. April represented the 14th time in the last 15 months that restaurant sales growth outpaced gains in overall retail sales.
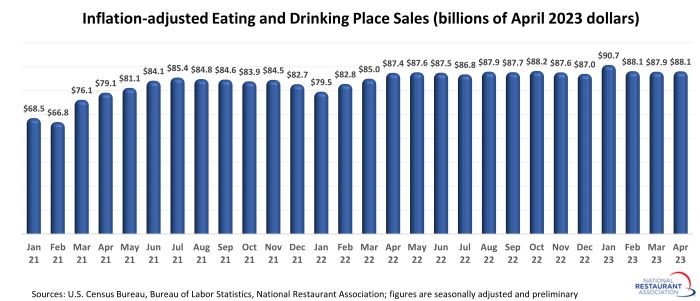
While total dollar spending in restaurants trended higher in recent months, much of that growth was due to rising menu prices. With the exception of January’s strong performance, real eating and drinking place sales remained relatively flat for much of the past year.
After adjusting for menu price increases, April’s eating and drinking place sales volume was just 0.7% above the April 2022 level. In nominal terms, eating and drinking place sales were up 9.4% during the 12-month period.
*Eating and drinking places are the primary component of the U.S. restaurant and foodservice industry, which prior to the coronavirus pandemic generated approximately 75% of total restaurant and foodservice sales. Monthly sales figures presented above represent total revenues at all eating and drinking place establishments. This differs from the National Restaurant Association’s sales projections, which represent food and beverage sales at establishments with payroll employees.
Read more analysis and commentary from the Association's chief economist Bruce Grindy.