Restaurant sales were relatively flat in recent months
Consumer spending in restaurants plateaued in recent months, which mirrored the gradual slowdown in the overall economy.
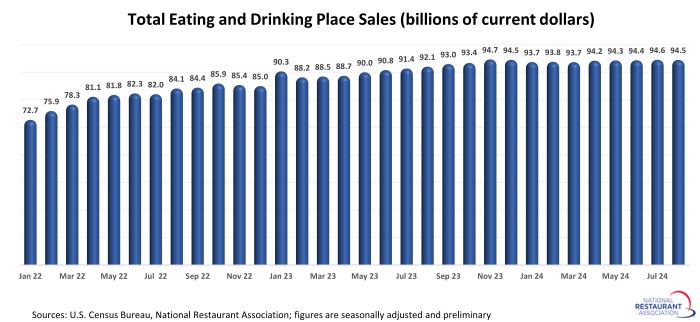
Eating and drinking places* registered total sales of $94.5 billion on a seasonally adjusted basis in August, according to preliminary data from the U.S. Census Bureau. That was essentially unchanged from the volumes posted in each of the previous four months.
August’s total sales volume of $94.5 billion stood just 2.7% above August 2023 levels. That represented the smallest 12-month increase during the pandemic recovery period, and was only slightly above the 2.0% gain in non-restaurant retail sales.
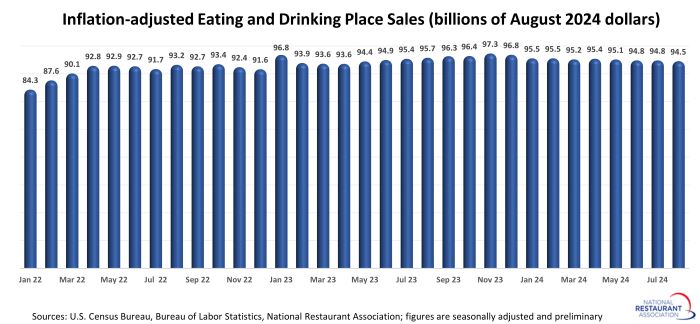
While overall restaurant sales were flat in recent months, menu prices continued to rise – albeit at a much slower pace than in 2022 and 2023. As a result, the trendline of real restaurant sales turned negative. After adjusting for menu price inflation, eating and drinking place sales declined 1.3% between August 2023 and August 2024.
Pent-up demand holding steady
The recent slowdown in restaurant sales growth was not due to a lack of interest among consumers. In fact, the National Restaurant Association’s measures of pent-up demand held relatively steady for much of the post-pandemic recovery period.
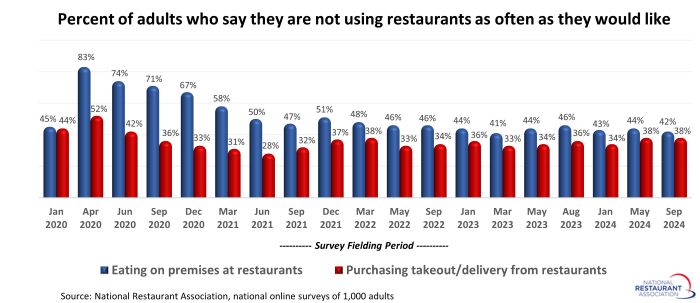
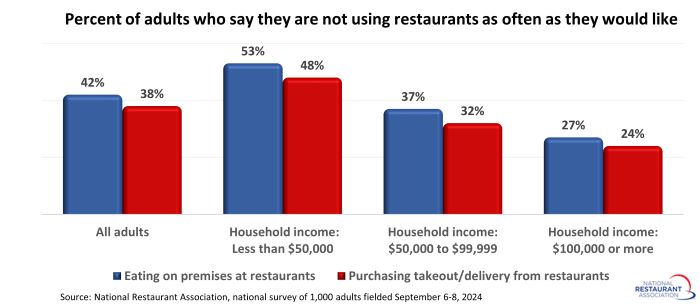
Forty-two percent of adults say they are not going out to restaurants as often as they would like, according to a survey fielded September 6-8, 2024. That was little changed from identical surveys fielded during the last 2 years.
Meanwhile, 38% of adults say they are not ordering takeout or delivery from restaurants as often as they would like. That was up slightly from recent surveys.
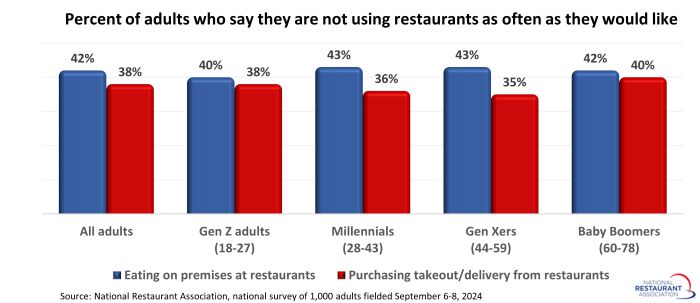
The latest readings of pent-up demand were relatively consistent across age groups. Forty-three percent of millennials and Gen Xers say they are not eating on premises at restaurants as often as they would like. That was similar to the sentiment among baby boomers (42%) and Gen Z adults (40%).
Four in 10 baby boomers and 38% of Gen Z adults say they are not ordering takeout or delivery from restaurants as often as they would like.
Pent-up demand is highest among lower-income households, with roughly half of consumers in households with income below $50,000 saying they would like to go out to restaurants and order takeout/delivery more frequently.
In comparison, 27% of adults living in households with income above $100,000 say they are not going out to restaurants as often as they would like.
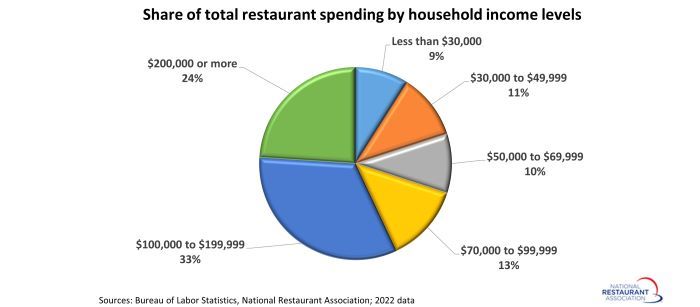
Unfulfilled demand among higher-income households is an important indicator for restaurants, as this cohort represents the majority of spending in the industry.
According to data from the Bureau of Labor Statistics, households with incomes of $200,000 or higher are responsible for 24% of the total spending on food away from home, while households with incomes between $100,000 and $199,999 account for 33% of industry spending.
Taken together, households with income above $100,000 are responsible for nearly 6 in 10 dollars spent in restaurants.
*Eating and drinking places are the primary component of the U.S. restaurant and foodservice industry and represent approximately 75% of total restaurant and foodservice sales. Monthly sales figures presented above represent total revenues at all eating and drinking place establishments. This differs from the National Restaurant Association’s sales projections, which represent food and beverage sales at establishments with payroll employees.
Read more analysis and commentary from the Association's economists.