Restaurant sales rose for the 6th straight month
The upward trend in restaurant sales continued in August, albeit on a somewhat more gradual path than the preliminary figures suggested.
Eating and drinking places* registered total sales of $90.8 billion on a seasonally adjusted basis in August, according to preliminary data from the U.S. Census Bureau. That was up 0.3% from July’s downward-revised sales volume of $90.5 billion.
August represented the sixth consecutive month of sales gains, with total restaurant spending rising 4.0% during this period. In comparison, total sales in non-restaurant retail sectors were up 1.0% during the last six months.
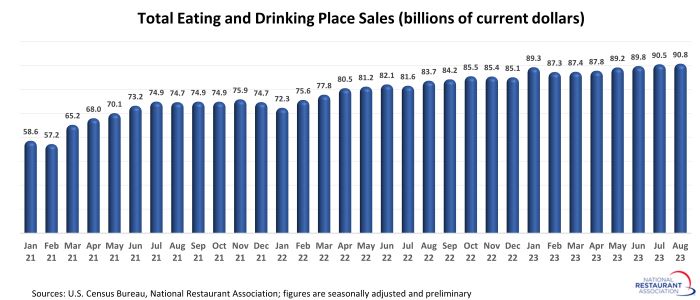
In inflation-adjusted terms, eating and drinking place sales were flat in August, as the 0.3% nominal sales gain was matched by a 0.3% increase in menu prices.
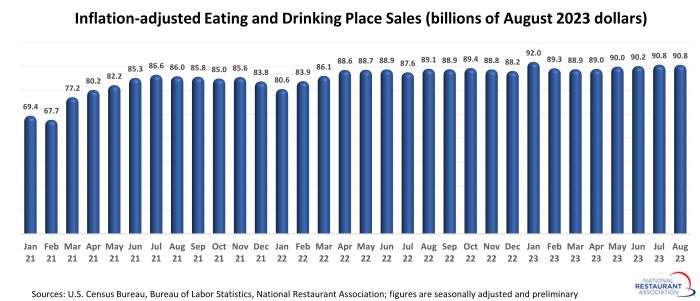
After adjusting for menu price inflation, eating and drinking place sales rose 1.8% between August 2022 and August 2023. While the trendline was modestly positive in recent months, August’s sales volume remained below January’s level in real terms.
Pent-up demand remains firm
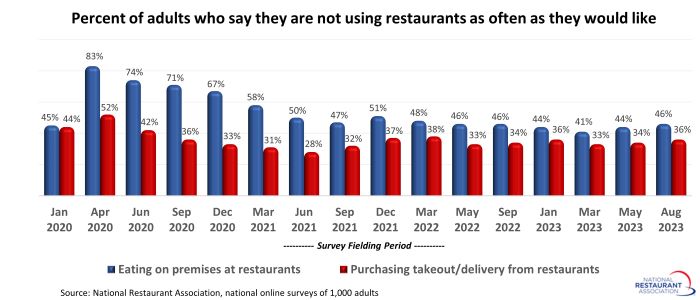
Based on the National Restaurant Association’s measures of pent-up demand, consumers will likely continue to visit restaurants in the coming months – as long as they have the financial wherewithal to do so.
Forty-six percent of adults say they are not going out to restaurants as often as they would like, according to a survey fielded August 25-27, 2023. That was essentially on par with consumers’ reporting in surveys fielded during the previous 12 months.
Meanwhile, 36% of adults say they are not ordering takeout or delivery from restaurants as often as they would like. That was also similar to readings in the last several surveys.
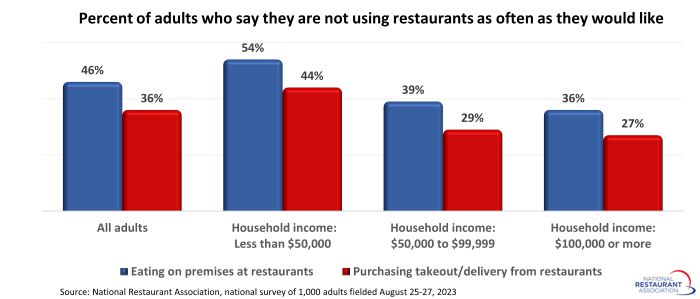
Not surprisingly, pent-up demand is higher among lower-income households, with 54% of consumers in households with income below $50,000 saying they would like to be going out to restaurants more frequently.
However, more than 1 in 3 adults living in households with income above $100,000 also say they are not dining out at restaurants as often as they would like.
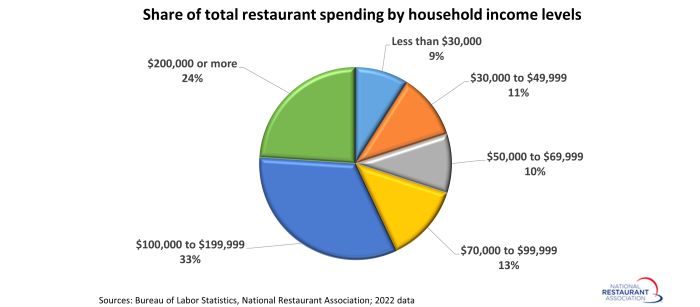
Any amount of unfulfilled demand among higher-income households is a positive sign for restaurants, as this demographic group represents the majority of spending in the industry.
According to data from the Bureau of Labor Statistics, households with incomes of $200,000 or higher are responsible for 24% of the total spending on food away from home, while households with incomes between $100,000 and $199,999 account for 33% of industry spending.
Taken together, households with income above $100,000 are responsible for nearly 6 in 10 dollars spent in restaurants.
*Eating and drinking places are the primary component of the U.S. restaurant and foodservice industry, which prior to the coronavirus pandemic generated approximately 75% of total restaurant and foodservice sales. Monthly sales figures presented above represent total revenues at all eating and drinking place establishments. This differs from the National Restaurant Association’s sales projections, which represent food and beverage sales at establishments with payroll employees.
Read more analysis and commentary from the Association's chief economist Bruce Grindy.