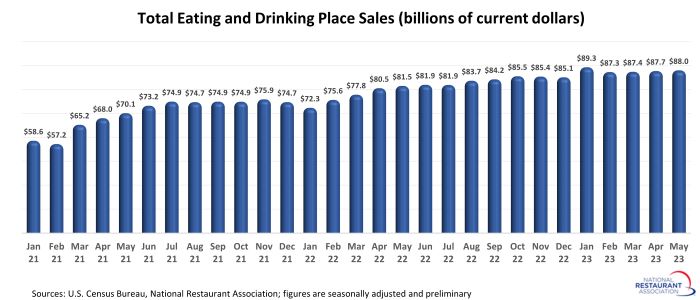
Restaurant sales continued to trend modestly higher in May
Eating and drinking places* registered total sales of $88.0 billion on a seasonally adjusted basis in May, according to preliminary data from the U.S. Census Bureau. That was up 0.4% from April’s downward-revised volume of $87.7 billion, but remained well below January’s recent high of $89.3 billion.
While the pace of sales growth slowed in recent months, restaurants were still top of mind for many consumers. Consumer spending in restaurants increased 8.0% during the last 12 months, while total spending in non-restaurant retail sectors rose just 0.7%.
Overall consumer spending in restaurants trended modestly higher in recent months, but much of that growth was the result of higher menu prices. In inflation-adjusted terms, the trendline of restaurant sales was flat to lower in recent months.
In nominal terms, eating and drinking place sales increased 8.0% between May 2022 and May 2023. However, after adjusting for menu price increases, eating and drinking place sales declined 0.3% during the 12-month period.

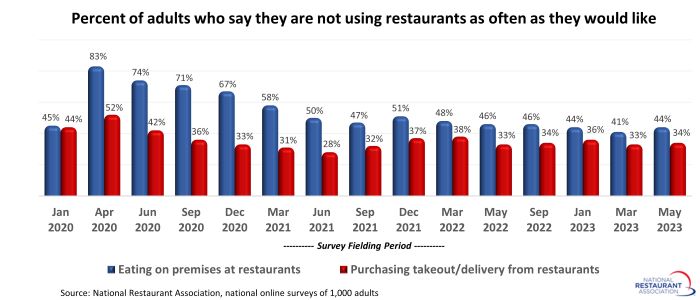
Pent up demand holding steady
Consumer spending may have leveled off in recent months, but the National Restaurant Association’s measures of pent-up demand held relatively firm. Forty-four percent of adults say they are not going out to restaurants as often as they would like, according to a survey fielded May 19-21, 2023. That was essentially on par with consumers’ reporting in surveys fielded during the previous 12 months.
Meanwhile, 34% of adults say they are not ordering takeout or delivery from restaurants as often as they would like. That was also similar to readings in the last several surveys.
*Eating and drinking places are the primary component of the U.S. restaurant and foodservice industry, which prior to the coronavirus pandemic generated approximately 75% of total restaurant and foodservice sales. Monthly sales figures presented above represent total revenues at all eating and drinking place establishments. This differs from the National Restaurant Association’s sales projections, which represent food and beverage sales at establishments with payroll employees.
Read more analysis and commentary from the Association's chief economist Bruce Grindy.