Restaurant Economic Insights Blog
Dr. Chad Moutray
October 9, 2024
The average health insurance plan for a family of four cost $25,572 in 2024, up 7% from 2023, according to the Kaiser Family Foundation’s latest annual survey. Indeed, the cost of providing health insurance has risen sharply, more than tripling since 2000, with roughly 20% growth since 2020, as shown in the accompanying chart. (For previous surveys, including a discussion of methodological changes over time, click here.) The survey does not break out health costs for restaurants, but the average cost of a family health insurance plan in the service sector was $25,600, essentially the same as the headline number.
The average cost of single coverage health insurance was $8,951 in 2024, up 6% from the previous year. For small firms, that figure was $9,131 on average, with larger firms paying $8,884 for single coverage. Similar to the family coverage data, the cost of offering health insurance for single coverage has also risen significantly, up nearly 19% from $7,470 in 2020 and jumping more than 2½ times from $2,517 in 2000.

Labor costs comprise 36.5% of total sales for a typical restaurant, as reported in the Restaurant Operations Data Abstract 2024. This figure includes wages, salaries, and employee benefits like health insurance. Many restaurants continue to express concern over rising expenses, as inflation compresses margins and puts additional pressure on operations. The increasing cost of health insurance further exacerbates these financial challenges, as highlighted by the data.
At the same time, it is important to note that health insurance remains an important and essential offering for many employees in the labor market, including for those in the restaurant and foodservice industry.
From that perspective, a record 81% of restaurant employees had health insurance coverage in 2022, according to data from the U.S. Census Bureau’s American Community Survey. Of those who have health insurance, 72% have private insurance, either in the employee’s name or someone else’s name, such as a parent or spouse. Coverage under a parent’s plan is likely common in the restaurant industry, as more than 4 in 10 restaurant employees are under the age of 26.
ISM: Service-Sector Growth Strengthened in September
Dr. Chad Moutray
October 3, 2024
The Institute for Supply Management reported a notable increase in service-sector confidence for September. The Services ISM® Purchasing Managers’ Index® rose from 51.5 in August to 54.9 in September, marking its highest level since February 2023. Index readings above 50 indicate expansion compared to the previous month, while values below 50 signal contraction. Survey respondents cited improved business conditions (up from 53.3 to 59.9) and a surge in new orders (up from 53.0 to 59.4), with both metrics growing at their fastest rates since early 2023.
These results suggest a positive outlook for service-sector businesses and the broader U.S. economy, which have both faced headwinds over the past few years. However, not all indicators were as strong. The employment index declined from 50.2 to 48.1, indicating softness in hiring, while prices increased from 57.3 to 59.4—the fastest pace of growth since January. Comments from survey participants reflected mixed perspectives on the economic environment, highlighting ongoing concerns about elevated interest rates and political uncertainty.

For restaurant operators, this report from the Institute for Supply Management might seem tangential. Although accommodation and foodservice businesses are part of the survey, the services sector encompasses a wide range of industries, making it less immediately relevant to restaurant-specific conditions.
Still, a rise in service-sector sentiment, as measured by the Services ISM® Purchasing Managers’ Index®, often signals positive outcomes for restaurants based on historical trends. There is a strong correlation between this measure and the National Restaurant Association’s Restaurant Performance Index (RPI), which rose 1.0% in August. If this pattern holds, another increase in the RPI could be expected for September.
The National Restaurant Association will continue to monitor industry conditions closely, particularly the relationship between the RPI and the broader services sector's performance, as indicators suggest resilient growth moving forward.

Restaurant Job Openings Rose in August, a Sign of Lingering Resilience in an Otherwise Cooling Labor Market
Dr. Chad Moutray
October 1, 2024
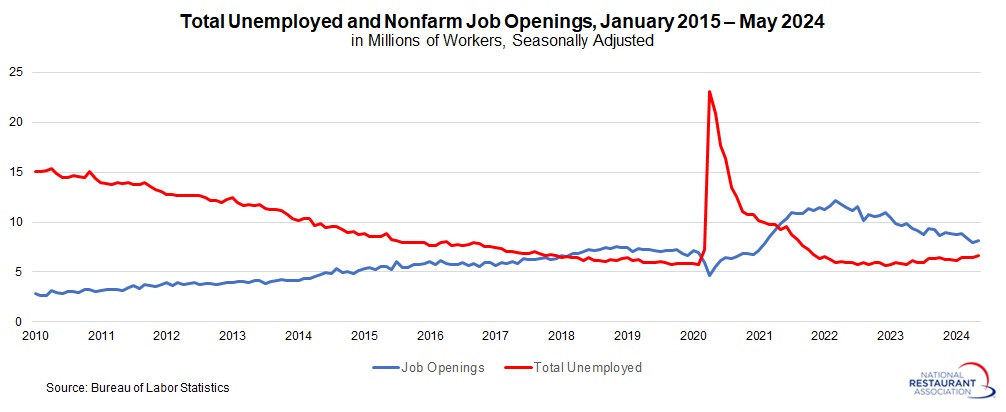
There were 903,000 accommodation and foodservices job openings in August, up from a revised 815,000 in July and a four-month high. While job postings in the accommodation and foodservice sector have cooled notably over the past year and a half, the pickup in openings in the latest data suggest underlying resilience in labor market demand. The current pace of job openings remains above what was experienced in the pre-pandemic (2017-2019) period, which was 835,000.
Meanwhile, accommodation and food services businesses hired 696,000 workers in August, down from 740,000 in July. At the same time, there were 636,000 total separations in the sector in August, down from 747,000 in July and a four-year low. Overall, these data are consistent with softening in the labor market, as each has trended lower over the past year. With that said, net hiring (or hiring minus separations) was solid in August at 60,000, the strongest monthly gain since January 2023.
.jpg "JOLTS-(2).jpg")
In the larger economy, nonfarm business job openings rose from 7,711,000 in July, the lowest since January 2021, to 8,040,000 in August. At the same time, there were 7,115,000 unemployed individuals reported in August. Therefore, for every 100 job openings in the U.S. economy, there were 88.5 unemployed workers.

While there continued to be significantly more job openings than people actively looking for work (roughly 925,000), that gap has narrowed significantly over the past year and a half. In contrast, it was nearly a 2-to-1 ratio in December 2022, or 51.8 unemployed workers for every 100 job openings, with a gap of more than 5.3 million more job openings people looking for employment at that time.
.jpg "unemployed-workers-per-job-opening-(1).jpg")
.jpg "quits-(2).jpg")
Dr. Chad Moutray
September 27, 2024
.jpg "PCE-deflator-sept2024-(1).jpg")
With that said, higher prices have also buoyed those data points. Real personal consumption expenditures have risen by a solid 2.9% year-over-year in chained 2017 dollars, while personal spending on foodservices and accommodations increased by a more modest 0.9% year-over-year.
.jpg "PCE-foodservices-and-accommodations-(3).jpg")
.jpg "savings-rate-sept2024-(2).jpg")
Dr. Chad Moutray
September 18, 2024
The Federal Open Market Committee reduced short-term interest rates at the conclusion of its September 17–18 meeting. It was the first time since March 2020 that the Federal Reserve has cut rates, which began moving sharply higher in the face of pricing pressures in March 2022. The federal funds rate has been in the 5.25% to 5.50% range since July 2023. After this latest meeting, the new federal funds range will be 4.75% to 5.00%.
The Committee notes, “Inflation made further progress toward the Committee’s 2 percent objective but remains somewhat elevated.” By cutting interest rates, the Federal Reserve is focusing on the risks for slowing economic and employment growth. At the same time, rates remain sufficiently high enough to target lingering pricing pressures in the economy, even with the sizable cut seen at this meeting.
For restaurant operators, the reduction in interest rates will be welcome news on two fronts. First, it suggests that the Federal Reserve is committed to achieving a “soft landing,” with lower rates helping to support more economic growth. Indeed, while the FOMC remains focused on its dual mandate of price stability and maximum employment, the shift to lower rates signals an increased emphasis on the latter. Second, reduced rates will also lower borrowing costs, both for consumers and businesses, and this should encourage more investment and spending.

Moreover, participants forecast 2.0% growth in real GDP in both 2024 and 2025, with the unemployment rate being 4.4% in both years. In terms of inflation, the core PCE deflator would decline to 2.6% by year’s end, falling to 2.2% in 2025 and getting nearer to the Fed’s long-term target.
Dr. Chad Moutray
September 4, 2024
There were 795,000 accommodation and foodservices job openings in July, down from a revised 816,000 in June. Overall, job postings in the accommodation and foodservices sector have cooled notably over the past year and a half, with the overall level normalizing dramatically from post-pandemic record highs. Over the last three months, job openings in the sector have averaged 786,000. This was lower than the average seen in the 2017–2019 period (835,000). As such, job openings in the sector have dropped below pre-pandemic levels.
Meanwhile, accommodation and food services businesses hired 782,000 workers in July, bouncing back from 626,000 in June, which was a post-pandemic low. (Excluding the pandemic, June’s reading was the weakest since November 2012.) At the same time, there were 787,000 total separations in the sector in July, up from 706,000 in June, which was a level not seen since October 2020. In sum, labor market activity in the sector remained challenged in July, with net hiring (or hires minus separations) of -5,000 for the month.
.jpg "JOLTS-(1).jpg")


.jpg "quits-(1).jpg")
Dr. Chad Moutray
August 30, 2024
The personal consumption expenditures deflator—the Federal Reserve’s preferred inflation measure—rose 0.2% in July after edging up by 0.1% in June. After inching up 0.1% in both May and June, food prices increased 0.2% in July. At the same time, energy costs were flat in July, stabilizing after declining by 2.1% in the prior two months. Excluding food and energy, the core PCE deflator increased 0.2% for the second straight month.
The PCE deflator has risen 2.5% since July 2023, the same year-over-year pace as in June and continuing to be the lowest since February 2021. Core inflation remained at 2.6% year-over-year in July for the third consecutive month, remaining the slowest pace since March 2021. Overall, these data show that pricing pressures have moderated significantly over the past couple of years, with the PCE deflator peaking at 7.1% year-over-year in June 2022 and core PCE inflation topping off at 5.5% in September of that year.

In other aspects of the latest report, personal consumption expenditures jumped 0.5% in July, up from 0.3% in June and a solid increase. Spending on foodservices and accommodations rose 0.4% in July, the strongest monthly gain in three months. Over the past 12 months, personal spending grew 5.3%, with foodservices and accommodation purchases up 4.7% since July 2023. These data suggest how consumer spending has helped buoy the U.S. economy, helping to provide resilience despite lingering challenges, including for foodservices and accommodations.
.jpg "PCE-foodservices-and-accommodations-(1).jpg")

Dr. Chad Moutray
August 29, 2024
The U.S. Census Bureau has introduced an experimental data set, the Business Trends and Outlook Survey (BTOS). This relatively new series “consists of approximately 1.2 million businesses split into six panels (approximately 200,000 cases per panel). Businesses in each panel will be asked to report once every 12 weeks for a year.” New data are released every other week, starting late last year through the present. This large sample of respondents includes restaurants, providing another data point to assess the health of the sector.
Similar to recent trends in the Restaurant Performance Index, the BTOS shows that conditions are challenging for eating and drinking places. While 51.4% of restaurants operators suggest that their business’s current performance is average in the latest survey (the 16th biweekly period in 2024), 30.7% suggest that conditions are either below average or poor while 18.0% feel that they are either above average or excellent. Moreover, those who were above average or excellent has slipped from 24.2% saying the same thing at the end of 2023, with 27.3% citing below average or poor conditions in the final survey of last years.

The result is that many of the key indices for the eating and drinking places sector have remained consistently below the key threshold of 50, reflecting more negative than positive sentiment. It is notable that restaurant operators began 2024 on a solidly negative note—including for revenues, employment, hours and demand—but conditions have stabilized somewhat since then, albeit still weaker than desired. In addition, the rate of decline lessened somewhat between the 15th and 16th biweekly survey for 2024.
While this might be disconcerting, one could also frame this more positively. In the latest survey, those restaurants feeling that their current performance was average, above average, or excellent totaled 69.4%. This perhaps suggests more resilience than not, even if conditions are weaker than ideal.


The National Restaurant Association will continue to monitor this new experimental data set, providing insights on upcoming trends in the restaurant sector in this exciting survey development.
Lightcast: Restaurant job postings and wage growth remain solid despite labor market cooling
Dr. Chad Moutray
August 7, 2024
Job openings are an important indicator of labor market dynamics, with sustained elevated levels suggesting a labor shortage. The Bureau of Labor Statistics’ Job Openings and Labor Turnover Survey (JOLTS) program is a commonly used source for job openings data and is based on a monthly survey of business establishments nationwide.
There were 866,000 job openings in June in the combined restaurants and accommodations sector, according to the JOLTS data from BLS. These data have decelerated notably following post-pandemic highs. Indeed, the overall level of job openings has essentially normalized to pre-pandemic levels.
Another measure of job openings is Lightcast, which aggregates online job posting from various websites with greater granularity. This differs from the BLS JOLTS data, which counts the number of positions that employers, including restaurants, are actively recruiting to fill, whether online or not. While the methodology and measurements of the two data sources are different, the trends typically move in similar directions.
******

Between July 2023 and July 2024, the bulk of these unique job postings were in limited-service and full-service restaurants, with 691,819 and 567.006 postings over the past 12 months, respectively.


.jpg "lightcast-top-15-occupations-(1).jpg")
******
A couple caveats should be noted:
- A single job posting could represent multiple positions at a company, particularly when restaurants are hiring several individuals for one role, potentially undercounting the true number that will be hired. (To be fair, companies might also post positions that ultimately lead to no action.)
- These data are not necessarily reconcilable with official figures from the Bureau of Labor Statistics, even as they offer some unique insights that complement those releases.
Dr. Chad Moutray
July 31, 2024
Private-sector wages and salaries in the accommodation and foodservices sector rose 1.6% in the Q2 2024 using non-seasonally adjusted data, up from 1.0% in Q1 2024 and the strongest quarterly pace since Q1 2023. Indeed, after showing signs of deceleration throughout much of 2023, the cost of wages and salaries for the sector have picked up so far in 2024.
With that said, there has been a very significant moderation in wages and salaries in the accommodation and foodservices sector since the heights of two years ago. Over the past 12 months, private-sector wages and salaries in the sector have risen 3.6%, up from 3.3% year-over-year in Q1 2024. While that represents a solid increase, it is down notably from the all-time high for this series, which was 9.4% year-over-year growth in Q1 2022. Indeed, the cost of wages and salaries have normalized to the average year-over-year growth rates seen in the pre-pandemic years of 2018 and 2019, which was 3.6%.
Note that one advantage of the Employment Cost Index data is that, unlike other labor market figures, it controls for composition of occupations within an industry. As such, it is said to be a better reflection of wage and salary costs over time within an industry, at least by some, including the Federal Reserve.

Restaurant job openings rebounded in June, but labor market has cooled notably
Dr. Chad Moutray
July 30, 2024
There were 866,000 accommodation and foodservices job openings in June, bouncing back from the 746,000 seen in May, which was the weakest reading since January 2021. Despite the uptick in the latest data, job postings in the accommodation and foodservices sector have cooled notably over the past year and a half, with the overall level normalizing dramatically from post-pandemic record highs.
Over the past three months, job openings in the sector have averaged 843,000, which is not far from the average seen in the 2017–2019 period (835,000). As such, job openings in the sector have essentially returned to pre-pandemic levels.
Meanwhile, accommodation and food services businesses hired just 678,000 workers in June, down from 789,000 in May and the weakest reading since April 2020. (Excluding the pandemic, it was the slowest hiring level since December 2014.) At the same time, there were 711,000 total separations in the sector in June, down from 771,000 in May and the lowest reading since October 2020. As such, labor market activity in the sector was challenged in June, with net hiring (or hires minus separations) of -33,000 for the month.

In the larger economy, nonfarm business job openings eased from 8,230,000 in May to 8,184,000 in June. There were 6,811,000 unemployed Americans reported in June. Therefore, for every 100 job openings in the U.S. economy, there were 83.2 unemployed workers.

Indeed, there continued to be significantly more job openings than people actively looking for work (roughly 1.4 million), even as that gap has narrowed significantly over the past year and a half. For example, it was nearly a 2-to-1 ratio in December 2022, or 51.8 unemployed workers for every 100 job openings, with a gap of nearly 4.7 million more job openings people looking for employment.
.jpg "unemployed-workers-per-nonfarm-opening-jun2024-(1).jpg")
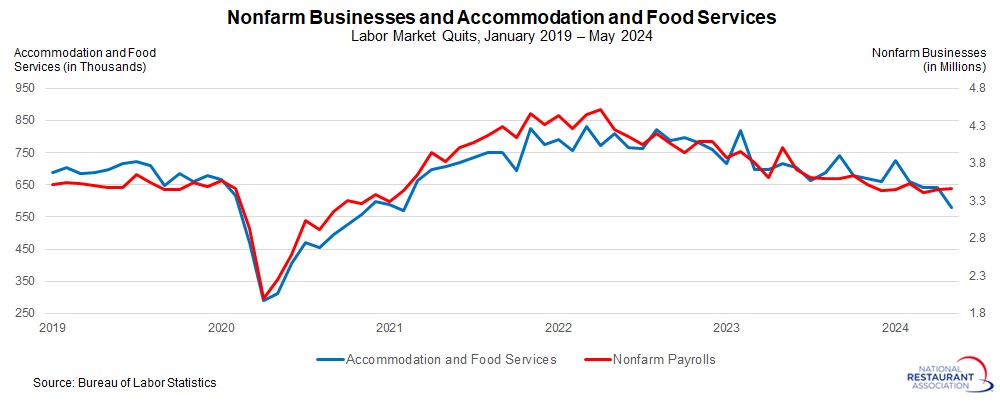
Meanwhile, the number of accommodation and food services quits decreased from 580,000 in May to 544,000 in June, the fewest since October 2020. Much like the openings data, the number of quits in the sector has been decelerating, with the averages for 2022 and 2023 being 787,000 and 704,000, respectively. This is a sign that churn in the labor market has ebbed notably in the past couple of years. In fact, quits are now well below the pre-pandemic average of 633,000 seen in the 2017 to 2019 period. At the same time, nonfarm payroll quits declined from 3,403,000 in May to 3,282,000 in June, the weakest since December 2020, with total quits just below but not far from the pre-pandemic average of 3,339,000.

The Fed's preferred inflation measure continues to reflect progress, paving the way for a possible September rate cut
Dr. Chad Moutray
July 26, 2024
The personal consumption expenditures deflator—the Federal Reserve’s preferred inflation measure—edged up 0.1% in June after being unchanged in May. Energy prices fell 2.1% for the second straight month in June, helping to keep a lid on inflationary pressures. Food costs inched up 0.1% for the second straight month. Excluding food and energy, the core PCE deflator increased 0.2% in June following the 0.1% gain seen in May.
The PCE deflator has risen 2.5% since June 2023, down from 2.6% year-over-year in May and the lowest since February 2021. At the same time, core inflation remained at 2.6% year-over-year in June for the second straight month, remaining the slowest pace since March 2021. Overall, these data show that pricing pressures have moderated significantly over the past couple of years, with the PCE deflator peaking at 7.1% year-over-year in June 2022 and core PCE inflation topping off at 5.5% in September of that year.

The Federal Open Market Committee’s stated goal is for core inflation to be 2% over the long-term. Getting to that threshold—the so-called “last mile” in the battle against inflation—has been challenging. Despite prices remaining somewhat sticky, core PCE inflation is likely to get closer to the Fed’s target by year’s end. Until there is more progress on inflation, the Federal Reserve has been hesitant to pull back on interest rates.
While there has been recent chatter about the need for the Federal Reserve to cut interest rates sooner, the FOMC is likely to stand pat on rates at its meeting next week on July 30–31. Instead, it will likely signal a willingness to decrease the federal funds rate at its September 17–18 meeting. Of course, incoming data would dictate whether such a move would be possible. In addition, the Fed should have sufficient time to gauge another cut later this year, likely at its December 17–18 meeting. (The FOMC also meets the week of the U.S. election on November 6–7.)
In other aspects of the latest report, personal consumption expenditures increased 0.3% in June, a solid gain despite easing from a gain of 0.4% in May. Spending on foodservices and accommodations was flat in June. In the first half of 2024, personal spending grew 2.3%, with foodservices and accommodation purchases up 1.1%. The year-over-year data remained encouraging, illustrating why the U.S. economy has remained so resilient, with personal spending up 5.2% since June 2023, including for foodservices and accommodations.

Personal incomes rose 0.2% in June, down from 0.4% in May. Wages and salaries increased 0.3% for the month. Over the past 12 months, wages and salaries have increased 4.7%. With spending outpacing income growth, the personal savings rate dropped to 3.4% in June, the lowest since December 2022.
U.S. economy grew 2.8% in second quarter, continuing to show resilience
Dr. Chad Moutray
July 25, 2024
The U.S. economy grew 2.8% at the annual rate in the second quarter of 2024, doubling the growth rate of 1.4% seen in first quarter and exceeding the consensus estimate of around 2.0%. As a result, the U.S. economy grew 2.1% at the annual rate in the first half of 2024, expanding a very modest pace but also continuing to show signs of resilience. The current forecast is for 2.6% growth in real GDP on average this year, not far from the 2.5% rate seen in 2023. (The year-over-year rate is seen rising 1.9% in the fourth quarter of 2024.)
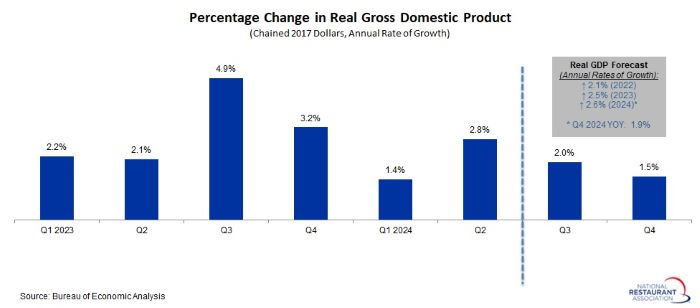
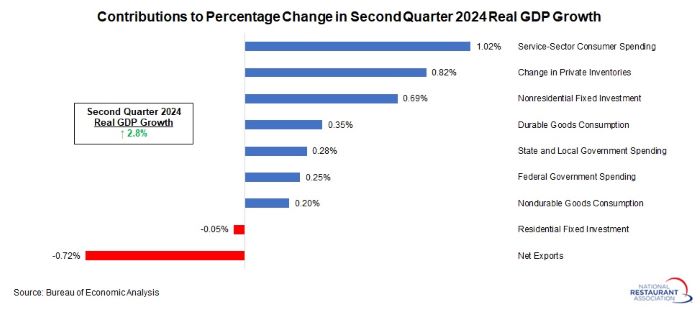
The underlying data were mixed. On the positive side, personal spending was stronger, rising from 1.5% at the annual rate in Q1 to 2.3% in Q2 and buoyed by rebounding purchases in goods. On the other hand, personal consumption expenditures in services slowed from 3.3% growth in Q1 to 2.2% in Q2. In addition, nonresidential fixed investment accelerated from 4.4% to 5.2%. With that said, fixed investment growth decelerated from 7.0% to 3.6%, pulled lower by declines in the housing market. Inventory spending, which had been a drag on growth in the previous two quarters, bounced back in Q2, with businesses restocking from recent depletions. Government spending was also positive, up from 1.8% to 3.1% for the quarter.
Consumer spending on foodservices and accommodations rose 2.5% from $1,066.7 billion in Q1 at the annual rate to $1,069.3 billion in Q2, rebounding after decreasing sharply in Q1. In the first half of 2024, personal consumption expenditures on foodservices and accommodations declined by an annualized 1.2%, down from the record $1,075.7 billion in Q4 2023.
Overall, personal consumption expenditures and gross private domestic investment (or business spending) contributed 3.03 percentage points to real GDP growth in the second quarter—a solid reading. Net exports were the largest negative in Q2, subtracting 0.72 percentage points from headline growth, as imports increased more strongly than exports.
Restaurant spending slightly exceeds pre-pandemic trend in inflation-adjusted dollars
Dr. Chad Moutray
July 15, 2024
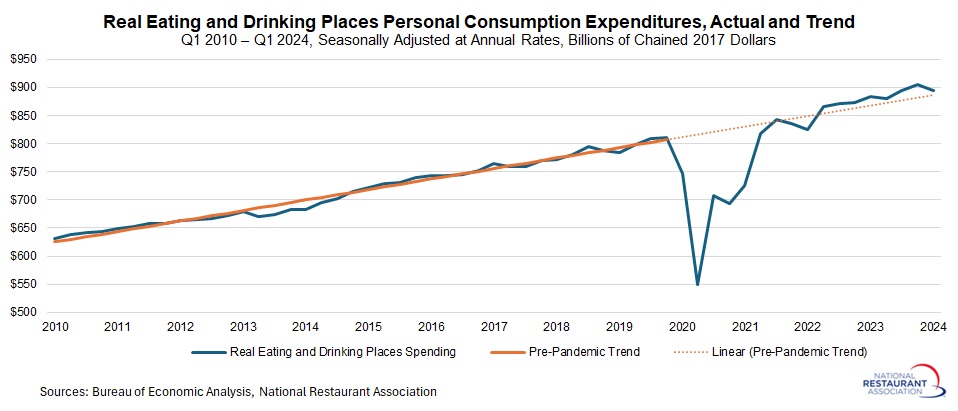
In the first quarter of 2024, spending at eating and drinking places totaled $1,208.0 billion at the annual rate, edging down from the record $1,210.5 billion in the fourth quarter of 2023, according to the Bureau of Economic Analysis.*
As can be seen from the accompanying table, current spending at restaurants and foodservice establishments remains well above the trend seen from 2010 to 2019. Indeed, if the pre-pandemic trend had continued unabated, spending at eating and drinking places would have been roughly $995.0 billion in Q1. As such, current spending levels are 21.5% higher than this trendline.

Obviously, price levels are also significantly higher today than before the pandemic, and this explains nearly all the gap between predicted and actual values.
In inflation-adjusted dollars, real spending at eating and drinking places totaled $895.3 billion in Q1 2024 at the annual rate, down from $905.0 billion in Q4 2023, which was an all-time high, expressed in chained 2017 dollars. If the pre-pandemic trend had continued, the current value for spending at eating and drinking places would have been $886.5 billion. Accordingly, the actual value of real spending at restaurants and foodservice establishments remains higher than the predicted trendline, but the gap is just one percent.
*These data come from the Personal Consumption Expenditures by Type of Product (Table 2.4.5) and the Real Personal Consumption Expenditures by Type of Product, Chained Dollars (Table 2.4.6) tables on the BEA website, looking specifically at the Foodservices component of Foodservices and Accommodations spending.
Restaurant job openings dropped sharply in May
Dr. Chad Moutray
July 2, 2024
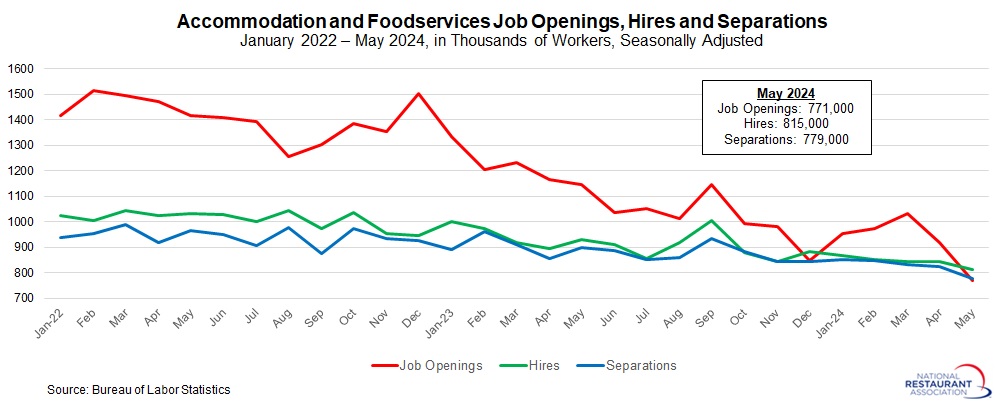
There were 771,000 accommodation and foodservices job openings in May, down sharply from 1,034,000 and 918,000 in March and April, respectively. While the labor market remains solid overall, these data suggest that job postings in the accommodation and foodservices sector have cooled notably in the past couple of months, with the overall level normalizing dramatically from post-pandemic record highs.
It is worth noting that the Job Openings and Labor Turnover Survey data can be highly volatile from month to month, and as such, one should not make too much of one month’s shift. As such, the June data will be closely watched to see if the large drop seen in May is sustained or possibly reversed, looking for the longer-term trend. For now, job openings in the sector have fallen below the average seen in the 2017–2019 period, which was 835,000.
Accommodation and food services businesses hired 815,000 in May, down from 843,000 in April. At the same time, there were 779,000 total separations in the sector in May, down from 827,000 in April and the lowest reading since February 2021. As such, labor market activity in the sector also slowed, but with net hiring (or hires minus separations) rising to 36,000 for the month.
In the larger economy, nonfarm business job openings increased from 7,919,000 in April to 8,140,000 in May, bouncing back somewhat after falling to the slowest pace since February 2021. There were 6,649,000 unemployed Americans reported in May. Therefore, for every 100 job openings in the U.S. economy, there were 81.7 unemployed workers.
Indeed, there continued to be significantly more job openings than people actively looking for work (roughly 1.5 million), even as that gap has narrowed significantly over the past year and a half. For example, it was nearly a 2-to-1 ratio in December 2022, or 51.8 unemployed workers for every 100 job openings, with a gap of nearly 4.7 million more job openings people looking for employment.
Meanwhile, the number of accommodation and food services quits decreased from 640,000 in April to 579,000 in May, the fewest since February 2021. Much like the openings data, the number of quits in the sector has been decelerating, with the averages for 2022 and 2023 being 787,000 and 704,000, respectively. This is a sign that churn in the labor market has ebbed notably in the past couple of years. In fact, quits are now below the pre-pandemic average of 633,000 seen in the 2017 to 2019 period. At the same time, nonfarm payroll quits edged up to 3,459,000 in May, with total quits above but not far from the pre-pandemic average of 3,339,000.
Restaurant output weakened in the first quarter but remained up over the past year
Dr. Chad Moutray
July 1, 2024
The U.S. economy grew 1.4% at the annual rate in Q1 2024, easing from 3.4% growth in Q4 2023 in real GDP and the slowest pace in seven quarters. The data on consumer spending was mixed, with individuals continuing to open their pocketbooks for services but with declining activity for goods purchases.
For its part, real gross output at eating and drinking places fell 1.6%, down from $1,004.0 billion in Q4 2023 to $988.5 billion in Q1 2024, expressed in billions of chained 2017 dollars and seasonally adjusted. This follows growth of 1.2% in Q4 2023, and it was the largest decline in two years. On a year-over-year basis, real gross output for eating and drinking places grew 0.8% in Q1 2024, a relatively sluggish (albeit positive) pace. Overall, eating and drinking places accounted for 2.8% of total real gross output for all private industries.

Of course, these data are impacted by prices. In current (or nominal) dollars, gross output at eating and drinking places declined less sharply, down 0.6% from a record $1,345.0 billion to $1,337.6 billion. It was the first quarterly decrease in two years, following the 2.4% increase in Q4 2023. On a year-over-year basis, gross output in the sector rose by a very positive 5.5%. In nominal terms, eating and drinking places accounted for 3.0% of total gross output for all private industries.

Search for AI jobs at restaurants
Dr. Chad Moutray
June 20, 2024
There continues to be a lot of excitement about how artificial intelligence will dramatically alter our lives, improving productivity and changing how companies and people do things. This has the potential to be worthy of the hype, with companies aggressively investing in new technologies and individuals experimenting with ChatGPT and other similar tools. Indeed, just this week, NVIDIA passed Microsoft and Apple to have the highest market cap of any public company, led by soaring demand for AI chips. (Microsoft and Apple are also investing heavily in artificial intelligence.)
Restaurants and foodservice operators are also beginning to spend in this area, with an eye on the future. The National Restaurant Association’s Restaurant Technology Landscape Report 2024, which was released in April, said that “22% of operators plan to devote resources to augmented reality for training or marketing campaigns, while 16% say they will invest in artificial intelligence (AI) integration (including voice recognition).” At the same time, one-third of limited-service customers said that they would be comfortable ordering food by talking to an artificial intelligence generated person on a video screen, but the comfort level rises with younger generations (49% for millennials).
While the sector is still early in the development of new AI-generated tools, restaurants and foodservice owners will continue to invest in new technologies and in human capital with such skills.
With that in mind, this post is an attempt to learn more about AI job openings in the sector utilizing Lightcast data, which aggregates online job postings from various websites. This differs from the BLS JOLTS data, which counts the number of positions that employers, including restaurants, are actively recruiting to fill, whether online or not. While the methodology and measurements of the two data sources are different, the trends typically move in similar directions.
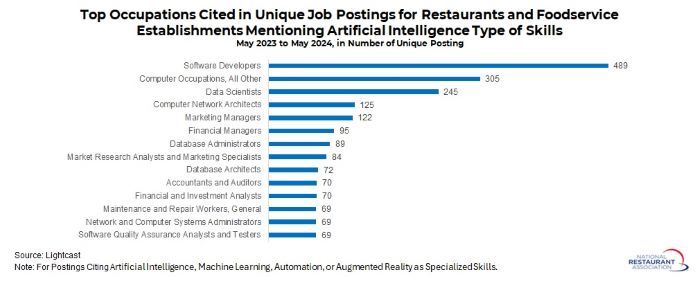
There were 3,889 unique job postings nationally between May 2023 and May 2024 for restaurants and foodservice establishments, limiting the query to openings that mention the following specialized skills: artificial intelligence, machine learning, automation, or augmented reality. The median advertised salary was $49.42 per hour, up 42% over the past three years. Most of these advertised jobs require at least a bachelor’s degree. It is too early to see a dramatic increase in the number of postings, but that could change moving forward.
Over the past year, the top cities for such job postings were (in order): Chicago, New York, Atlanta, Seattle and Dallas. The top occupations being recruited at restaurants and food service establishments over the past year mentioning AI-type specialized skills were software developers, all other computer occupations, data scientists, computer network architects and marketing managers, among others. Beyond the specialized skills mentioned in the query, other common skills noted as requirements in the postings included knowledge of computer science, Python, SQL, agile methodology, project management and data analysis, to name a few.
Federal Reserve leaves rates unchanged, signals just one cut this year
Dr. Chad Moutray
June 12, 2024
The Federal Open Market Committee left short-term interest rates unchanged, as expected, at the conclusion of its June 11–12 meeting. The statement noted that inflation “remains elevated” despite making “modest progress toward the Committee’s 2 percent inflation objective.” Moreover, it noted that “the risks to achieving its employment and inflation goals have moved toward a better balance over the past year.” Yet, it added that “the Committee remains highly attentive to inflation risks.” Indeed, stubborn price growth remains a challenge, with the Federal Reserve committed to having “higher for longer” interest rates until it sees sufficient progress.
With that in mind, the Federal Reserve also released the economic projections of the participants. In March, the median estimate was for three rate cuts in the federal funds rate in 2024. That is now just one, which furthers the estimation that the first cut might come after the election at the conclusion of its December 17–18 meeting. (These are just projections. With incoming data, FOMC participants might feel that conditions are sufficient to warrant a rate cut sooner, perhaps at the September 17–18 meeting.)
Participants forecast 2.1% and 2.0% growth in real GDP in 2024 and 2025, respectively, with the unemployment rate remaining at its current level, 4.0%. The Fed predicts an unemployment rate of 4.2% next year. In terms of inflation, the core PCE deflator would be 2.8% this year, declining to 2.3% in 2025 and getting nearer to the Fed’s long-term target.
Dining Dynamism: Restaurant start-ups remain strong despite slowing year to date
Dr. Chad Moutray
June 12, 2024
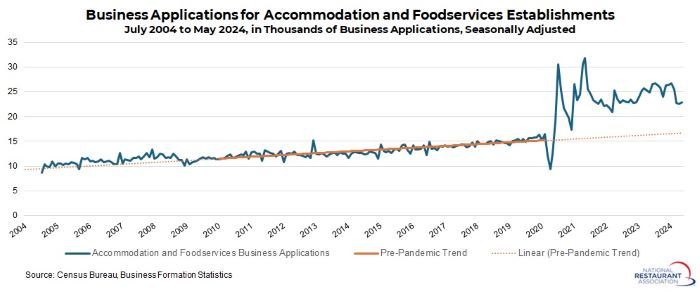
In May, there were 22,918 business applications filed for new accommodation and foodservices establishments, according to seasonally adjusted figures from the Census Bureau. These data, which are part of the Business Formation Statistics series, compile applications for an Employee Identification Number (EIN). It is important to note that this series focuses on business applications only. It does not highlight openings or closings.
Business applications in the accommodation and foodservices sector edged up from 22,648 in April following three straight months of declines, down from 26,663 in January. Moreover, applications have eased significantly since peaking at a record 31,862 in May 2021. Despite pulling back over the past three years, start-ups in the accommodation and foodservices sector remain well above the pre-pandemic trend.
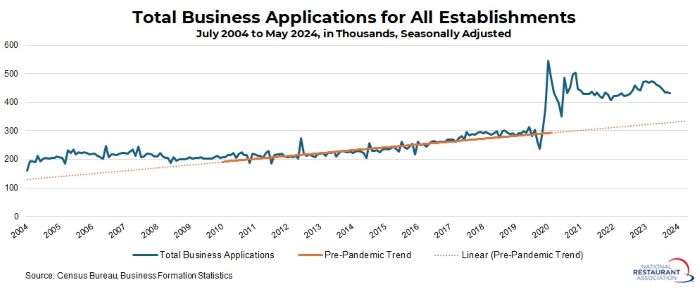
The chart below shows an upward trend in business applications from January 2010 to February 2020. If we were to extend this pre-pandemic trend, there would currently be nearly 16,575 accommodation and foodservices business applications, with the actual number notably higher than that.
Indeed, business applications jumped considerably post-pandemic, and even with some stabilization, that new trend remains well above what was seen in the years before it. As a society, we have become more entrepreneurial in general, and this occurrence extends to restaurants, foodservice operations and accommodations, which is now 38.3% above trend.
The Business Formation Statistics data begin in July 2004, and over that period, accommodation and foodservices business applications have averaged 5.45% of total applications. In May, it was 5.41%. Much like the data discussed above, the business applications rate in the sector peaked at 6.34% in May 2021, an all-time high, and have pulled back since then.
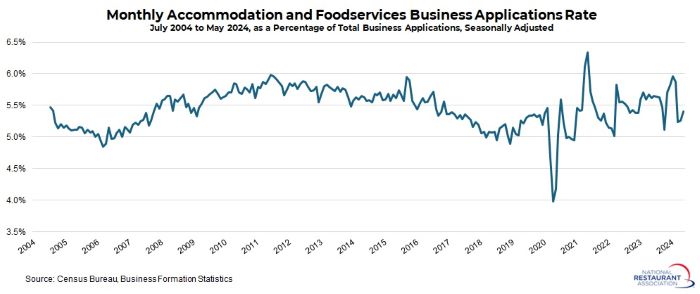
The current business formation rate for the sector is not far from the historical average despite the sizable leap in applications post-pandemic. This suggests that total applications have also soared since February 2020, which they have.
There were 423,945 total business applications in May, with these data largely pulling back over the past 10 months from 473,722 in July 2023. In the aftermath of the pandemic, Americans leaned heavily into starting their own businesses, with a record 545,914 applications files in July 2021.
The number of applications has settled somewhat since then but remain highly elevated and above the pre-pandemic pace in a manner similar to accommodation and foodservice establishments. If we were to extend the pre-pandemic trend, there would be roughly 330,710 business applications today, or 28.2% fewer than the actual figure.
National economy added 272,000 jobs in May
Dr. Chad Moutray
June 7, 2024
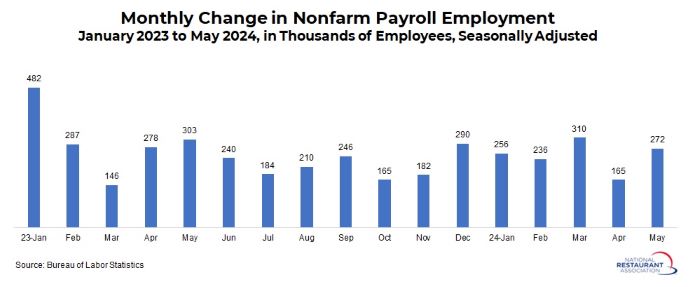
Nonfarm payroll job growth rose by 272,000 workers in May on a seasonally adjusted basis, rebounding from the gain of 165,000 seen in April. This was stronger than the consensus expectations of around 190,000 employees being added in the month. Overall, U.S. job growth remains solid, with 1,239,000 net new workers added year to date.
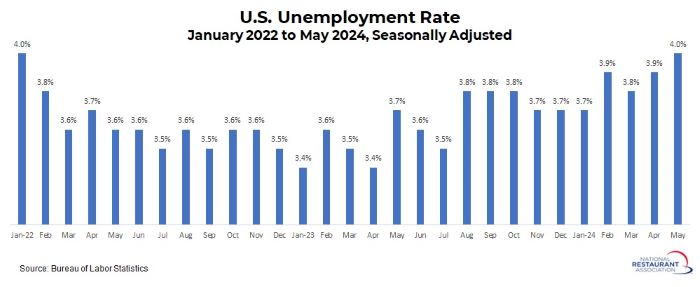
The unemployment rate ticked up from 3.9% in April to 4.0% in May, remaining a strong figure despite rising to the highest rate since January 2022. The number of unemployed Americans rose from 6,492,000 to 6,649,000. At the same time, the labor force participation rate slipped from 62.7% to 62.5%.
Job growth continued across both the private and public sectors in May, including a gain of 24,600 for eating and drinking places. The private sector added a net 229,000 jobs in May, while government employment increased by 43,000. Here is a breakdown of the employment growth in May by sector (ranked from highest to least):
• Private education and health services (up 86,000)
• Leisure and hospitality (up 42,000, including 24,600 for eating and drinking places)
• Local government (up 34,000)
• Professional and business services (up 33,000)
• Trade, transportation and utilities (up 27,000, including 12,600 for retail sales)
• Construction (up 21,000)
• Financial activities (up 10,000)
• Manufacturing (up 6,000)
• Other services (up 6,000)
• Federal government (up 4,000)
• State government (up 5,000)
• Information (unchanged)
• Mining and logging (down 4,000)
Restaurant job openings cooled in April
Dr. Chad Moutray
June 5, 2024
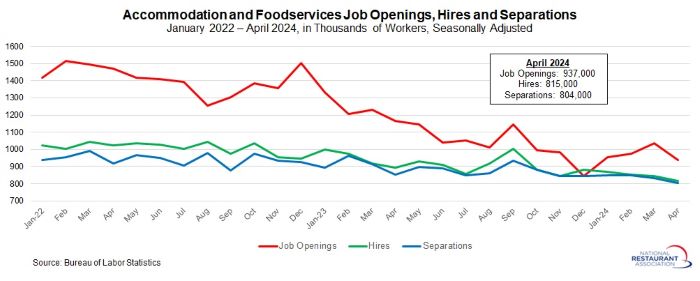
There were 937,000 accommodation and food services job openings in April, down from 1,034,000 in March. This data continues to reflect a labor market that remains solid despite notable cooling over the past year, with accommodation and food services job openings still above pre-pandemic levels (but that gap is narrowing).
Over the past six months, job openings in the sector have averaged 955,000. In comparison, job openings were 1,410,000 and 1,075,000 in calendar years 2022 and 2023, respectively. For a pre-pandemic comparison, the average number of job openings in the sector in the 2017–2019 period was 835,000. As such, job postings for accommodation and food services businesses remain elevated and above pre-pandemic levels, but with these data normalizing.
Accommodation and food services businesses hired 815,000 in April, down from 845,000 in March. At the same time, there were 804,000 total separations in the sector in April, down from 834,000 in March. The data reflect some slowing in labor market activity overall, with 11,000 net new hires in both March and April.
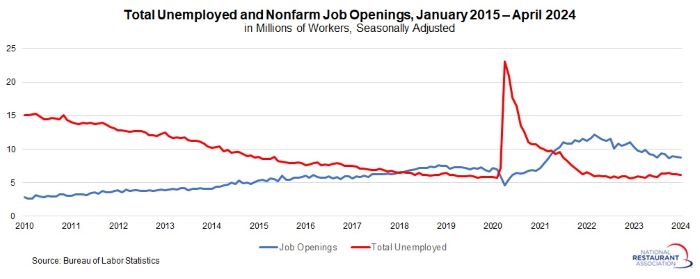
As such, there continued to be significantly more job openings than people actively looking for work (roughly 1.6 million), even as that gap has narrowed significantly over the past year and a half. For example, it was nearly a 2-to-1 ratio in December 2022, or 51.8 unemployed workers for every 100 job openings, with a gap of nearly 4.7 million more job openings people looking for employment.
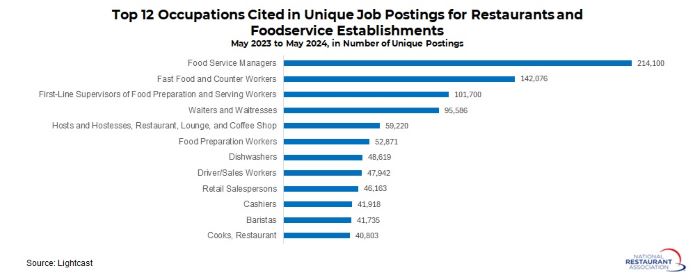
Between May 2023 and May 2024, 53.6% of job postings among restaurants and foodservice establishments were from limited-service restaurants, with 44.2% from full-service restaurants. The remainder were from snack and nonalcoholic beverage bars or cafeterias and buffets.
The top occupations being recruited at restaurants and food service establishments over the past year were food service managers, fast food and counter workers, first-line supervisors of food preparation and serving workers and wait staff, among others.
Track more economic indicators and read more analysis and commentary from the Association's economists.