Menu prices
Menu price growth continued to slow in April, even as inflation remained somewhat elevated
The Consumer Prices Index rose 0.3% in April, slowing after increasing by 0.4% in both February and March. Over the past 12 months, consumer prices have risen 3.4%, edging down from 3.5% year-over-year in March.
At the same time, core consumer prices (which exclude food and energy) also increased 0.3% in April after rising by 0.4% in the prior two months. Core inflation rose 3.6% year-over-year in April, down from 3.8% in both February and March and the slowest pace since April 2021.
Overall, these data highlight a mixed picture for consumer inflation. On the positive side, core inflation continues to moderate, albeit not as fast as desired. Indeed, consumer prices continue to remain somewhat elevated, even with progress over the past year.
For its part, the Federal Open Market Committee is expected to keep interest rates unchanged at the next two meetings (June 11–12 and July 30–31). With inflation remaining stronger than preferred, the Federal Reserve is likely to wait until there are clearer signs of pricing progress before it starts the process of normalizing rates. This could still occur at the September 17–18 FOMC meeting, but such a move would hinge on whether incoming data reflect sufficient headway on inflation. Indeed, policymakers continue to make it clear that rates will stay “higher for longer” until more progress is made.

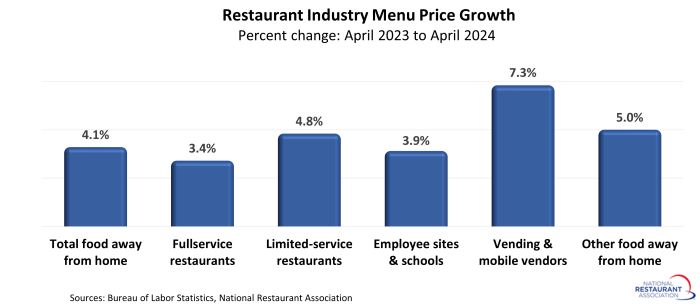
Menu prices rose 4.1% during the last 12 months
Menu prices grew 0.3% for the second straight month in April. The Consumer Price Index for Food Away from Home increased 4.1% between April 2023 and April 2024, the slowest year-over-year rate of growth for menu prices since May 2021.
Meanwhile, grocery prices declined 0.2% in April after being flat in both February and March. The Consumer Price Index for Food at Home rose 1.1% between April 2023 and April 2024, down from 1.2% year-over-year in March. Overall, grocery price growth has decelerated sharply over the past year, falling from the peak of 13.5% year-over-year in August 2022.

Within the food-away-from-home sector, limited-service menu prices outpaced the fullservice segment in recent months, although growth rates in both price indices are well below their recent highs. Prices for limited-service meals and snacks increased 4.8% between April 2023 and April 2024. That was the smallest 12-month increase since August 2020, after peaking at 8.2% year-over-year in April 2023.
Fullservice menu prices rose 3.4% between April 2023 and April 2024, up from 3.2% year-over-year in March. Growth in fullservice menu prices also eased notably, after topping out at 9.0% year-over-year for several months in 2022.

Elsewhere in the food-away-from-home sector, the price index for food from vending machines and mobile vendors increased 7.3% between April 2023 and April 2024, up from 6.2% year-over-year in March, which was the slowest in two years. Despite the uptick, these prices have slowed significantly from the double-digit percent gains posted during 2023.
The price index for food at employee sites and schools increased 3.9% between April 2023 and April 2024, up from 3.7% year-over-year in March. This component had been significantly dampened for much of 2021 and 2022, which BLS attributed to widespread free school lunch programs. As these programs expired, many students went from paying nothing to paying regular prices for school lunches. That resulted in sharp year-over-year increases in this price index from mid-2022 to mid-2023. These base effects are now running their course, which will result in a normalization of this price index as well as its outsized impact on the overall Consumer Price Index for Food Away from Home.
On a regional level, the Northeast (4.6%), and West (4.3%) regions saw the strongest menu price growth between April 2023 and April 2024. Average menu prices in the South and Midwest region increased at a comparatively modest 3.9% rate during the last 12 months.

Track more economic indicators and read more analysis and commentary from the Association's economists.